 Photo from Tikit
Originally Posted On: https://www.tikit.ai/how-to-create-a-ticketing-dashboard-in-microsoft-teams-using-power-bi/
With Tikit, managing work directly from Microsoft Teams has never been easier. But Tikit also provides an intuitive web app experience for administrators and analysts looking to glean even more information and insight–especially from analytics.
Using the Tikit Web App, you can filter columns, add columns and even export to Excel if you want to run your own calculations. But whether you choose to export daily, weekly or even monthly, there is a reoccurring process that can surely be improved. That’s why we’re opening up API access to Tikit, and in doing so, facilitating the ability to retrieve data directly without manual exports. This gives you an easy way to hook up Power BI and build your own ticketing dashboards to analyze on your own or share with co-workers.
To fast track you through the process, we’ve built a Power BI Template that you can download, plugin your token and go. But what’s a token and where do you get one?
Step 1: Get an Authentication Token
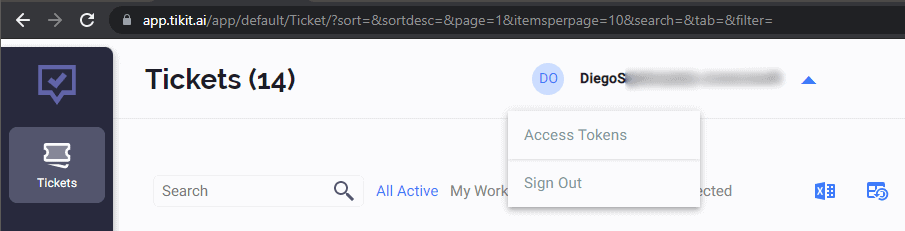
The first thing we need to do is create a token at https://app.tikit.ai. Then in the top right, click on your name, then click “Access Tokens.”
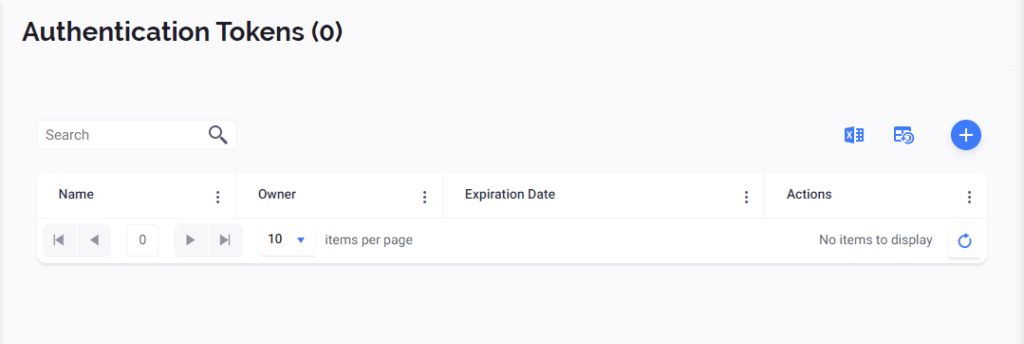
This page shows a list of tokens you have currently generated for Tikit. To create a new one, just click on the “+ icon” on the right.
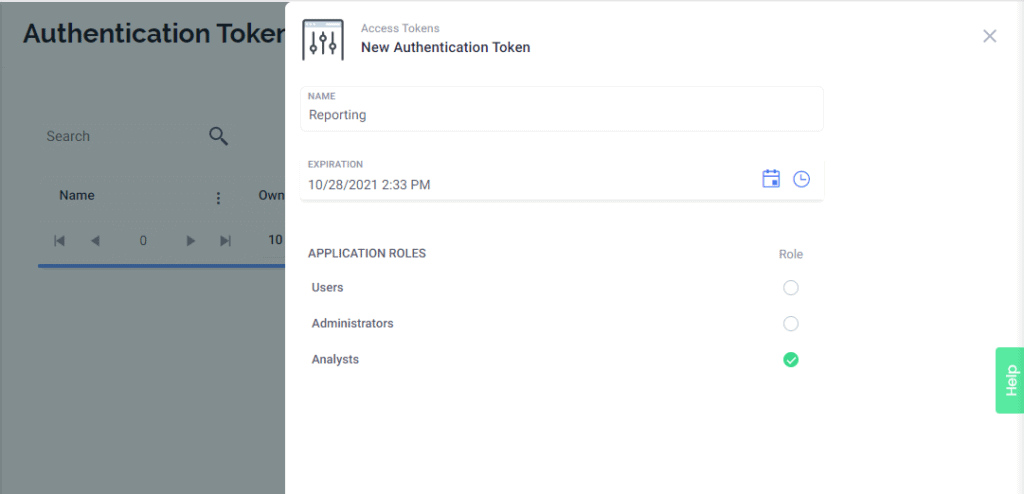
Let’s give the new token a name like Reporting, set an expiration date and choose “Analysts” for the Application Roles. Then click “Save.”
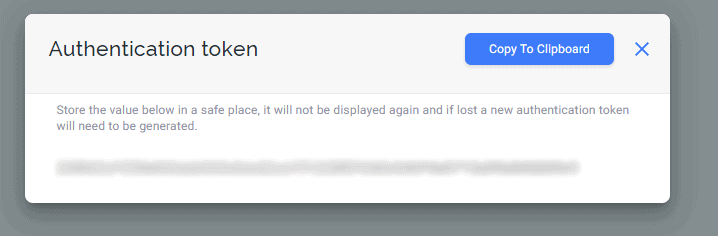
A new window appears showing you the token you have just created. Per the message, this token will be shown once and never again! Make sure to protect your token like any password you may use.
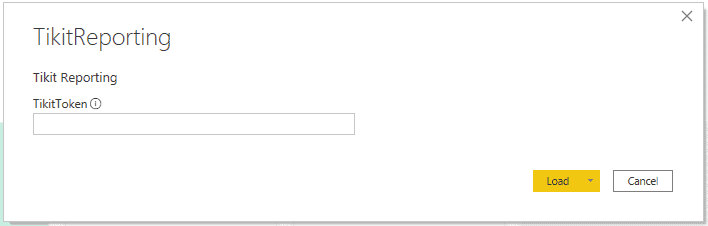
With our new token, open the Power BI Template with Power BI Desktop if you haven’t already done so, paste it in and click Load.
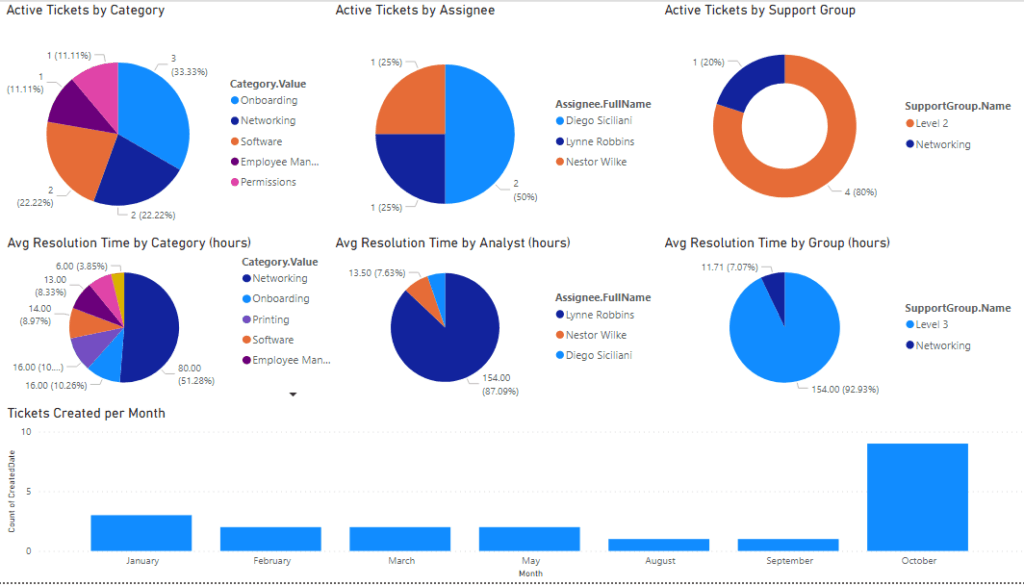
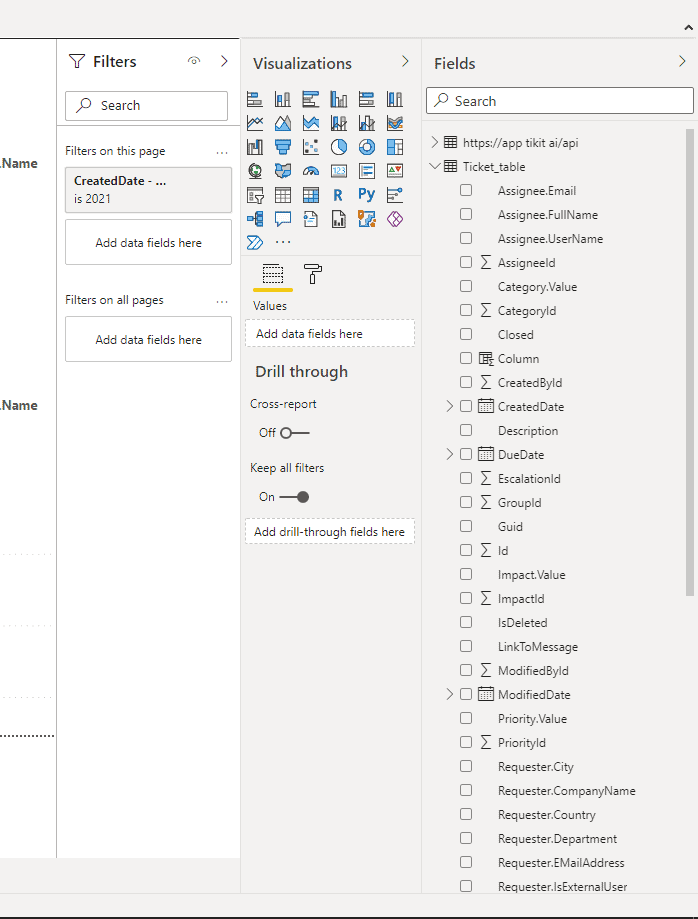
Data will be retrieved and then charts will render. But if you aren’t using Groups yet, don’t worry about those charts being empty!
Now that you’re connected to Tikit, you’re free to build your own dashboards simply by selecting data points you want to visualize. Just click them to enable and choose the chart type you want to use to display your data. You can also select any of the charts displayed above to see how they’re constructed and the filters that are applied.
With those few steps, you can start creating your own ticketing dashboards. Reminder: you can find the Tikit Web App at https://app.tikit.ai.
In our next blog post, we’ll dive deeper into analyzing Tikit data. We’ll go over how to build custom dashboards and publish them directly into Teams. New to Tikit? Contact us with questions and join our growing community.


