


Viacom Inc. (NASDAQ:VIAB, VIA) today reported financial results for the quarter and fiscal year ended September 30th, 2018.
This press release features multimedia. View the full release here: https://www.businesswire.com/news/home/20181116005159/en/
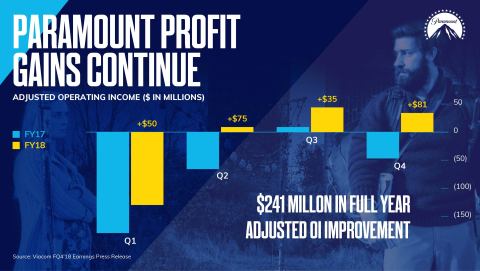
Paramount delivered a third consecutive quarter of profitability and $241 million in full-year adjusted operating income improvement. (Graphic: Viacom)
STATEMENT FROM BOB BAKISH, PRESIDENT & CEO
“Our strong performance in the fourth quarter capped off a pivotal year for Viacom. We successfully turned around our core business, with dramatic improvements across our networks, at Paramount and in distribution. We also took important steps to evolve Viacom for the future – investing in our portfolio of advanced marketing solutions, digital and experiential offerings and global studio production business. As we head into 2019, we are excited about the company’s evolution and expect to return to topline growth.”
Fiscal Year 2018 Results | ||||||||||||||||||||||||||||||||||||||
$ millions, except per share amounts | ||||||||||||||||||||||||||||||||||||||
Quarter Ended September 30, | Year Ended September 30, | |||||||||||||||||||||||||||||||||||||
| 2018 | 2017 | B/(W)% | 2018 | 2017 | B/(W)% | |||||||||||||||||||||||||||||||||
| GAAP | ||||||||||||||||||||||||||||||||||||||
| Revenues | $ | 3,485 | $ | 3,319 | 5 | % | $ | 12,943 | $ | 13,263 | (2 | )% | ||||||||||||||||||||||||||
| Operating income | 645 | 705 | (9 | ) | 2,570 | 2,489 | 3 | |||||||||||||||||||||||||||||||
| Net earnings from continuing operations attributable to Viacom | 386 | 674 | (43 | ) | 1,688 | 1,871 | (10 | ) | ||||||||||||||||||||||||||||||
| Diluted EPS from continuing operations | 0.96 | 1.67 | (43 | ) | 4.19 | 4.67 | (10 | ) | ||||||||||||||||||||||||||||||
| Non-GAAP* | ||||||||||||||||||||||||||||||||||||||
| Adjusted operating income | $ | 670 | $ | 578 | 16 | % | $ | 2,795 | $ | 2,743 | 2 | % | ||||||||||||||||||||||||||
| Adjusted net earnings from continuing operations attributable to Viacom | 400 | 310 | 29 | 1,659 | 1,511 | 10 | ||||||||||||||||||||||||||||||||
| Adjusted diluted EPS from continuing operations | 0.99 | 0.77 | 29 | 4.12 | 3.77 | 9 | ||||||||||||||||||||||||||||||||
* Non-GAAP measures referenced in this release are detailed in the Supplemental Disclosures at the end of this release. | ||||||||||||||||||||||||||||||||||||||
FILMED ENTERTAINMENT
Paramount Pictures continued its momentum in FQ4 with strong growth at the box office and in television production, delivering $241 million in full year adjusted operating income improvement.
Quarterly Financial Results | |||||||||||||||||||||||||||||||
$ millions | |||||||||||||||||||||||||||||||
FQ4’18 | Total | B/(W)% | Domestic | B/(W)% | International | B/(W)% | |||||||||||||||||||||||||
| Revenues | $ | 984 | 25 | % | $ | 400 | 26 | % | $ | 584 | 24 | % | |||||||||||||||||||
| Theatrical | 337 | 193 | 108 | 315 | 229 | 157 | |||||||||||||||||||||||||
| Licensing | 435 | 3 | 148 | 14 | 287 | (2 | ) | ||||||||||||||||||||||||
| Home Entertainment | 157 | (17 | ) | 103 | (15 | ) | 54 | (22 | ) | ||||||||||||||||||||||
| Ancillary | 55 | (10 | ) | 41 | 3 | 14 | (33 | ) | |||||||||||||||||||||||
| Adj. Operating Income | $ | 38 | n/m* | * n/m: not meaningful | |||||||||||||||||||||||||||
- Paramount Pictures has improved YOY adjusted operating income for seven straight quarters, with growth in FQ4 benefitting from the performances of Mission: Impossible – Fallout, A Quiet Place and Book Club.
- Double-digit gains in FQ4 total revenues were driven by a nearly 3X increase in worldwide theatrical revenues and growth in worldwide licensing.
- Higher worldwide theatrical revenues in FQ4 reflect the strong box office performance of Mission: Impossible – Fallout.
-
The increase in FQ4 worldwide licensing revenues benefited from
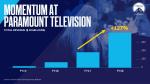
continued growth at Paramount Television, with notable deliveries,
including Maniac.
- Paramount Television grew revenues +127% YOY to over $400 million in FY18.
- Lower worldwide home entertainment revenues in FQ4 reflect the number and mix of available titles.
- The decrease in FQ4 worldwide ancillary revenues reflects lower international revenues, partially offset by domestic growth.
Operational Highlights |
- Mission: Impossible – Fallout was #1 at the global box office in FQ4. It is the most successful film of the franchise, grossing nearly $800 million to date.
- With a production cost of approximately $20 million, A Quiet Place grossed more than $340 million at the worldwide box office. Released in April, it is the second highest grossing horror film in the U.S. over the past decade.
- Comedy hit Book Club grossed nearly $75 million worldwide – more than seven times its acquisition cost of $10 million.
- Paramount Pictures has built a diverse theatrical film slate of 13 titles for FY19 – up from nine in FY18 – that feature big-budget tentpoles, targeted-audience productions and Viacom-branded films.- Upcoming releases include the latest installment of the Transformers franchise, Bumblebee; the BET co-branded film What Men Want; animated feature Wonder Park; a reboot of Stephen King’s horror classic Pet Sematary; and the Elton John biopic Rocketman.
-
Paramount Television delivered nine series to air in FY18, with FQ4
premieres including Tom Clancy’s Jack Ryan on
Amazon and Maniac on Netflix.
-
Anticipated to grow revenues +50% in FY19, with 16 series ordered
for production:
- Nine new shows, including The Haunting of Hill House for Netflix, Catch-22 for Hulu and First Wives Club for Paramount Network.
- Seven returning series, including third seasons of 13 Reasons Why for Netflix and Berlin Station for EPIX, and second seasons of Tom Clancy’s Jack Ryan for Amazon and The Alienist for TNT.
-
Anticipated to grow revenues +50% in FY19, with 16 series ordered
for production:
MEDIA NETWORKS
Viacom Media Networks returned domestic affiliate revenues and total adjusted operating income to growth in FQ4, strengthened audience share and accelerated initiatives in content production, digital consumption and ad solutions.
Quarterly Financial Results | ||||||||||||||||||||||||||||||||||||
$ millions | ||||||||||||||||||||||||||||||||||||
FQ4’18 | Total | B/(W)% | Domestic | B/(W)% | International | B/(W)% | FX B/(W)% | |||||||||||||||||||||||||||||
| Revenues | $ | 2,520 | (1 | )% | $ | 1,966 | - | % | $ | 554 | (7 | )% | (8 | )% | ||||||||||||||||||||||
| Affiliate | 1,192 | 4 | 972 | 3 | 220 | 10 | (6 | ) | ||||||||||||||||||||||||||||
| Advertising | 1,147 | (6 | ) | 896 | (4 | ) | 251 | (13 | ) | (10 | ) | |||||||||||||||||||||||||
| Ancillary | 181 | - | 98 | 29 | 83 | (21 | ) | (5 | ) | |||||||||||||||||||||||||||
| Adj. Operating Income | $ | 708 | 2 | % | ||||||||||||||||||||||||||||||||
- Worldwide affiliate growth in FQ4 partially offset lower worldwide advertising revenues. Domestic revenues held flat, while the impact of foreign exchange drove lower international revenues.
-
Worldwide affiliate revenues in FQ4 were driven by domestic growth and
double-digit international gains.
- Domestic affiliate revenues delivered +1,100 bps of sequential improvement in growth rate in the year.
- Advanced Marketing Solutions (AMS) revenues – including those from Vantage – grew +32% YOY in FQ4, partially offsetting the decrease in linear domestic ad revenues, while the unfavorable impact of foreign exchange drove lower international ad revenues.
- Live events and consumer products drove double-digit growth in FQ4 domestic ancillary revenues, offsetting lower international revenues.
- Adjusted OI returned to growth in FQ4, benefiting from lower programming expenses and cost transformation savings.
Operational Highlights |
-
Viacom held the #1 share of U.S. basic cable viewing across key
audiences in FQ4, including viewers 2-49, 2-11, 12-17, 18-34 and
18-49, with particular strength at MTV, BET and Comedy Central.
- Viacom brands in FQ4 had six of the 10 highest-rated original cable series among Adults 18-34, including season two of MTV’s Jersey Shore: Family Vacation – the most-watched unscripted show on cable in the demo.
- Internationally, Channel 5 returned to audience share growth in FQ4, while Telefe achieved 10 months of ratings leadership as of October.
- Viacom more than doubled YOY global social video views in FQ4, jumping from #24 to #10 in Tubular media industry rankings. Viacom doubled its YouTube subscribers in FY18 with launches of dedicated channels for hit franchises including MTV’s Wild ‘N Out.
- AMS continued to scale, generating more than $300 million in full-year revenues, and doubling its contribution from 5% of total domestic advertising revenues in FY16 to 10% in FY18. Vantage had its best quarter ever in FQ4, with revenues up 75% YOY.
-
Viacom continued to build its studio production business to create
content for third parties globally. Recent wins include:
- The August release of Awesomeness’ To All the Boys I’ve Loved Before – one of Netflix’s most-watched original films ever.
- Nickelodeon’s partnership with Netflix on a live-action series of Avatar: The Last Airbender, with production starting in 2019.
- The launch of MTV Studios, which announced a three-season deal with Facebook Watch in October to reimagine MTV’s The Real World for global audiences.
- The growth of Viacom International Studios (VIS), driven by production partnerships with Amazon, Cablevisión, Fox Network Group Latin America, Netflix and Telemundo. Through VIS, Viacom is now a leading global producer of original Spanish-language content, with more than 700 hours delivered in FY18.
BALANCE SHEET AND LIQUIDITY
Progress in operating performance combined with de-levering actions strengthened the balance sheet and drove improvements across key metrics in the full year.
- At September 30, 2018, total debt outstanding was $10.08 billion, a reduction of over $1 billion during the year and approximately $3 billion since we announced our strategy to de-lever in February 2017. Total adjusted gross debt was $9.43 billion.
- Cash balance grew by $168 million to approximately $1.6 billion for the full year.
- Net cash provided by operating activities increased $150 million, or 9%, to $1.82 billion for the full year.
- Free cash flow grew $167 million, or 11%, to $1.64 billion, and operating free cash flow grew $134 million, or 9%, to $1.64 billion for the full year.
About Viacom
Viacom creates entertainment experiences that
drive conversation and culture around the world. Through television,
film, digital media, live events, merchandise and solutions, our
brands connect with diverse, young and young at heart audiences
in more than 180 countries.
For more information on Viacom and its businesses, visit www.viacom.com. Viacom may also use social media channels to communicate with its investors and the public about the company, its brands and other matters, and those communications could be deemed to be material information. Investors and others are encouraged to review posts on Viacom’s Twitter feed (twitter.com/viacom), Facebook page (facebook.com/viacom) and LinkedIn profile (linkedin.com/company/viacom).
Cautionary Statement Concerning Forward-Looking Statements
This
news release contains both historical and forward-looking statements.
All statements that are not statements of historical fact are, or may be
deemed to be, forward-looking statements. Forward-looking statements
reflect our current expectations concerning future results, objectives,
plans and goals, and involve known and unknown risks, uncertainties and
other factors that are difficult to predict and which may cause future
results, performance or achievements to differ. These risks,
uncertainties and other factors include, among others: technological
developments, alternative content offerings and their effects in our
markets and on consumer behavior; competition for content, audiences,
advertising and distribution in a swiftly consolidating industry; the
public acceptance of our brands, programs, films and other entertainment
content on the various platforms on which they are distributed; the
impact on our advertising revenues of declines in linear television
viewing, deficiencies in audience measurement and advertising market
conditions; the potential for loss of carriage or other reduction in the
distribution of our content; evolving cybersecurity and similar risks;
the failure, destruction or breach of our critical satellites or
facilities; content theft; increased costs for programming, films and
other rights; the loss of key talent; domestic and global political,
economic and/or regulatory factors affecting our businesses generally;
volatility in capital markets or a decrease in our debt ratings; a
potential inability to realize the anticipated goals underlying our
ongoing investments in new businesses, products, services and
technologies; fluctuations in our results due to the timing, mix, number
and availability of our films and other programming; potential conflicts
of interest arising from our ownership structure with a controlling
stockholder; and other factors described in our news releases and
filings with the Securities and Exchange Commission, including but not
limited to our 2018 Annual Report on Form 10-K and reports on Form 10-Q
and Form 8-K. The forward-looking statements included in this document
are made only as of the date of this document, and we do not have any
obligation to publicly update any forward-looking statements to reflect
subsequent events or circumstances. If applicable, reconciliations for
any non-GAAP financial information contained in this news release are
included in this news release or available on our website at www.viacom.com.
| VIACOM INC. | ||||||||||||||||||||||||
| CONSOLIDATED STATEMENTS OF EARNINGS | ||||||||||||||||||||||||
| (Unaudited) | ||||||||||||||||||||||||
| Quarter Ended | Year Ended | |||||||||||||||||||||||
| September 30, | September 30, | |||||||||||||||||||||||
| ($ millions, except per share amounts) | 2018 | 2017 | 2018 | 2017 | ||||||||||||||||||||
| Revenues | $ | 3,485 | $ | 3,319 | $ | 12,943 | $ | 13,263 | ||||||||||||||||
| Expenses: | ||||||||||||||||||||||||
| Operating | 1,954 | 1,885 | 6,879 | 7,436 | ||||||||||||||||||||
| Selling, general and administrative | 807 | 800 | 3,056 | 3,005 | ||||||||||||||||||||
| Depreciation and amortization | 54 | 56 | 213 | 223 | ||||||||||||||||||||
| Restructuring and related costs | 25 | - | 225 | 237 | ||||||||||||||||||||
| Total expenses | 2,840 | 2,741 | 10,373 | 10,901 | ||||||||||||||||||||
| Gain on asset sale | - | 127 | - | 127 | ||||||||||||||||||||
| Operating income | 645 | 705 | 2,570 | 2,489 | ||||||||||||||||||||
| Interest expense, net | (132 | ) | (149 | ) | (560 | ) | (618 | ) | ||||||||||||||||
| Equity in net earnings of investee companies | 4 | 3 | 9 | 81 | ||||||||||||||||||||
| Gain on sale of EPIX | - | - | - | 285 | ||||||||||||||||||||
| Other items, net | (7 | ) | 12 | (22 | ) | (25 | ) | |||||||||||||||||
| Earnings from continuing operations before provision for income taxes | 510 | 571 | 1,997 | 2,212 | ||||||||||||||||||||
| Provision for income taxes | (111 | ) | 124 | (269 | ) | (293 | ) | |||||||||||||||||
| Net earnings from continuing operations | 399 | 695 | 1,728 | 1,919 | ||||||||||||||||||||
| Discontinued operations, net of tax | 8 | - | 31 | 3 | ||||||||||||||||||||
| Net earnings (Viacom and noncontrolling interests) | 407 | 695 | 1,759 | 1,922 | ||||||||||||||||||||
| Net earnings attributable to noncontrolling interests | (13 | ) | (21 | ) | (40 | ) | (48 | ) | ||||||||||||||||
| Net earnings attributable to Viacom | $ | 394 | $ | 674 | $ | 1,719 | $ | 1,874 | ||||||||||||||||
| Amounts attributable to Viacom: | ||||||||||||||||||||||||
| Net earnings from continuing operations | $ | 386 | $ | 674 | $ | 1,688 | $ | 1,871 | ||||||||||||||||
| Discontinued operations, net of tax | 8 | - | 31 | 3 | ||||||||||||||||||||
| Net earnings attributable to Viacom | $ | 394 | $ | 674 | $ | 1,719 | $ | 1,874 | ||||||||||||||||
| Basic earnings per share attributable to Viacom: | ||||||||||||||||||||||||
| Continuing operations | $ | 0.96 | $ | 1.67 | $ | 4.19 | $ | 4.68 | ||||||||||||||||
| Discontinued operations | 0.02 | - | 0.08 | 0.01 | ||||||||||||||||||||
| Net earnings | $ | 0.98 | $ | 1.67 | $ | 4.27 | $ | 4.69 | ||||||||||||||||
| Diluted earnings per share attributable to Viacom: | ||||||||||||||||||||||||
| Continuing operations | $ | 0.96 | $ | 1.67 | $ | 4.19 | $ | 4.67 | ||||||||||||||||
| Discontinued operations | 0.02 | - | 0.08 | 0.01 | ||||||||||||||||||||
| Net earnings | $ | 0.98 | $ | 1.67 | $ | 4.27 | $ | 4.68 | ||||||||||||||||
| Weighted average number of common shares outstanding: | ||||||||||||||||||||||||
| Basic | 403.1 | 402.4 | 402.7 | 399.9 | ||||||||||||||||||||
| Diluted | 403.3 | 402.4 | 403.0 | 400.6 | ||||||||||||||||||||
| Dividends declared per share of Class A and Class B common stock | $ | 0.20 | $ | 0.20 | $ | 0.80 | $ | 0.80 | ||||||||||||||||
| VIACOM INC. | ||||||||||||
| CONSOLIDATED BALANCE SHEETS | ||||||||||||
| (Unaudited) | ||||||||||||
| ($ millions, except par value) | September 30, | September 30, 2017 | ||||||||||
| ASSETS | ||||||||||||
| Current assets: | ||||||||||||
| Cash and cash equivalents | $ | 1,557 | $ | 1,389 | ||||||||
| Receivables, net | 3,141 | 2,970 | ||||||||||
| Inventory, net | 896 | 919 | ||||||||||
| Prepaid and other assets | 482 | 523 | ||||||||||
| Total current assets | 6,076 | 5,801 | ||||||||||
| Property and equipment, net | 919 | 978 | ||||||||||
| Inventory, net | 3,848 | 3,982 | ||||||||||
| Goodwill | 11,609 | 11,665 | ||||||||||
| Intangibles, net | 313 | 313 | ||||||||||
| Other assets | 1,018 | 959 | ||||||||||
| Total assets | $ | 23,783 | $ | 23,698 | ||||||||
| LIABILITIES AND EQUITY | ||||||||||||
| Current liabilities: | ||||||||||||
| Accounts payable | $ | 433 | $ | 431 | ||||||||
| Accrued expenses | 848 | 869 | ||||||||||
| Participants’ share and residuals | 719 | 825 | ||||||||||
| Program obligations | 662 | 712 | ||||||||||
| Deferred revenue | 398 | 463 | ||||||||||
| Current portion of debt | 567 | 19 | ||||||||||
| Other liabilities | 427 | 434 | ||||||||||
| Total current liabilities | 4,054 | 3,753 | ||||||||||
| Noncurrent portion of debt | 9,515 | 11,100 | ||||||||||
| Participants’ share and residuals | 523 | 384 | ||||||||||
| Program obligations | 498 | 477 | ||||||||||
| Deferred tax liabilities, net | 296 | 294 | ||||||||||
| Other liabilities | 1,186 | 1,323 | ||||||||||
| Redeemable noncontrolling interest | 246 | 248 | ||||||||||
| Commitments and contingencies | ||||||||||||
| Viacom stockholders’ equity: | ||||||||||||
| Class A common stock, par value $0.001, 375.0 authorized; 49.4 and 49.4 outstanding, respectively | - | - | ||||||||||
| Class B common stock, par value $0.001, 5,000.0 authorized; 353.7 and 353.0 outstanding, respectively | - | - | ||||||||||
| Additional paid-in capital | 10,145 | 10,119 | ||||||||||
| Treasury stock, 393.1 and 393.8 common shares held in treasury, respectively | (20,562 | ) | (20,590 | ) | ||||||||
| Retained earnings | 18,561 | 17,124 | ||||||||||
| Accumulated other comprehensive loss | (737 | ) | (618 | ) | ||||||||
| Total Viacom stockholders’ equity | 7,407 | 6,035 | ||||||||||
| Noncontrolling interests | 58 | 84 | ||||||||||
| Total equity | 7,465 | 6,119 | ||||||||||
| Total liabilities and equity | $ | 23,783 | $ | 23,698 | ||||||||
| VIACOM INC. | ||||||||||||
| CONSOLIDATED STATEMENTS OF CASH FLOWS | ||||||||||||
| (Unaudited) | ||||||||||||
| ($ millions) | Year Ended | |||||||||||
| 2018 | 2017 | |||||||||||
| OPERATING ACTIVITIES | ||||||||||||
| Net earnings (Viacom and noncontrolling interests) | $ | 1,759 | $ | 1,922 | ||||||||
| Discontinued operations, net of tax | (31 | ) | (3 | ) | ||||||||
| Net earnings from continuing operations | 1,728 | 1,919 | ||||||||||
| Reconciling items: | ||||||||||||
| Depreciation and amortization | 213 | 223 | ||||||||||
| Feature film and program amortization | 4,785 | 4,739 | ||||||||||
| Equity-based compensation | 57 | 68 | ||||||||||
| Equity in net earnings and distributions from investee companies | (2 | ) | (14 | ) | ||||||||
| Gain on asset sales | (16 | ) | (412 | ) | ||||||||
| Deferred income taxes | (45 | ) | (174 | ) | ||||||||
| Operating assets and liabilities, net of acquisitions: | ||||||||||||
| Receivables | (250 | ) | (132 | ) | ||||||||
| Production and programming | (4,606 | ) | (4,412 | ) | ||||||||
| Accounts payable and other current liabilities | (45 | ) | (207 | ) | ||||||||
| Other, net | 3 | 74 | ||||||||||
| Net cash provided by operating activities | 1,822 | 1,672 | ||||||||||
| INVESTING ACTIVITIES | ||||||||||||
| Acquisitions and investments, net | (112 | ) | (378 | ) | ||||||||
| Capital expenditures | (178 | ) | (195 | ) | ||||||||
| Proceeds received from asset sales | 57 | 848 | ||||||||||
| Grantor trust proceeds | 9 | 54 | ||||||||||
| Net cash provided by/(used in) investing activities | (224 | ) | 329 | |||||||||
| FINANCING ACTIVITIES | ||||||||||||
| Borrowings | — | 2,569 | ||||||||||
| Debt repayments | (1,000 | ) | (3,352 | ) | ||||||||
| Dividends paid | (322 | ) | (319 | ) | ||||||||
| Exercise of stock options | 2 | 172 | ||||||||||
| Other, net | (90 | ) | (81 | ) | ||||||||
| Net cash used in financing activities | (1,410 | ) | (1,011 | ) | ||||||||
| Effect of exchange rate changes on cash and cash equivalents | (20 | ) | 20 | |||||||||
| Net change in cash and cash equivalents | 168 | 1,010 | ||||||||||
| Cash and cash equivalents at beginning of period | 1,389 | 379 | ||||||||||
| Cash and cash equivalents at end of period | $ | 1,557 | $ | 1,389 | ||||||||
SUPPLEMENTAL DISCLOSURES REGARDING NON-GAAP FINANCIAL INFORMATION
The following tables reconcile our results of operations reported in accordance with accounting principles generally accepted in the United States of America (“GAAP”) for the quarter and year ended September 30, 2018 and 2017 to adjusted results that exclude the impact of certain items identified as affecting comparability (non-GAAP). We use consolidated adjusted operating income, adjusted earnings from continuing operations before provision for income taxes, adjusted provision for income taxes, adjusted net earnings from continuing operations attributable to Viacom and adjusted diluted earnings per share (“EPS”) from continuing operations, as applicable, among other measures, to evaluate our actual operating performance and for planning and forecasting of future periods. We believe that the adjusted results provide relevant and useful information for investors because they clarify our actual operating performance, make it easier to compare Viacom’s results with those of other companies and allow investors to review performance in the same way as our management. Since these are not measures of performance calculated in accordance with accounting principles generally accepted in the United States of America, they should not be considered in isolation of, or as a substitute for, operating income, earnings from continuing operations before provision for income taxes, provision for income taxes, net earnings from continuing operations attributable to Viacom and diluted EPS from continuing operations as indicators of operating performance, and they may not be comparable to similarly titled measures employed by other companies.
| Quarter Ended | ||||||||||||||||||||||||||||||
| ($ millions, except per share amounts) | September 30, 2018 | |||||||||||||||||||||||||||||
| Earnings from | Net Earnings | |||||||||||||||||||||||||||||
| Continuing | from Continuing | |||||||||||||||||||||||||||||
| Operations | Operations | Diluted EPS | ||||||||||||||||||||||||||||
| Operating | Before Provision | Provision for | Attributable to | from Continuing | ||||||||||||||||||||||||||
| Income | for Income Taxes | Income Taxes (1) | Viacom | Operations | ||||||||||||||||||||||||||
| Reported results (GAAP) | $ | 645 | $ | 510 | $ | 111 | $ | 386 | $ | 0.96 | ||||||||||||||||||||
| Factors Affecting Comparability: | ||||||||||||||||||||||||||||||
| Restructuring and related costs (2) | 25 | 25 | 7 | 18 | 0.05 | |||||||||||||||||||||||||
| Discrete tax benefit (3) | - | - | 4 | (4 | ) | (0.02 | ) | |||||||||||||||||||||||
| Adjusted results (Non-GAAP) | $ | 670 | $ | 535 | $ | 122 | $ | 400 | $ | 0.99 | ||||||||||||||||||||
| Year Ended | ||||||||||||||||||||||||||||||
| ($ millions, except per share amounts) | September 30, 2018 | |||||||||||||||||||||||||||||
| Earnings from | Net Earnings | |||||||||||||||||||||||||||||
| Continuing | from Continuing | |||||||||||||||||||||||||||||
| Operations | Operations | Diluted EPS | ||||||||||||||||||||||||||||
| Operating | Before Provision | Provision for | Attributable to | from Continuing | ||||||||||||||||||||||||||
| Income | for Income Taxes | Income Taxes (1) | Viacom | Operations | ||||||||||||||||||||||||||
| Reported results (GAAP) | $ | 2,570 | $ | 1,997 | $ | 269 | $ | 1,688 | $ | 4.19 | ||||||||||||||||||||
| Factors Affecting Comparability: | ||||||||||||||||||||||||||||||
| Restructuring and related costs (2) | 225 | 225 | 55 | 170 | 0.42 | |||||||||||||||||||||||||
| Gain on extinguishment of debt (4) | - | (25 | ) | (6 | ) | (19 | ) | (0.05 | ) | |||||||||||||||||||||
| Gain on asset sale (5) | - | (16 | ) | - | (16 | ) | (0.04 | ) | ||||||||||||||||||||||
| Investment impairment (6) | - | 46 | 10 | 36 | 0.09 | |||||||||||||||||||||||||
| Discrete tax benefit (3) | - | - | 200 | (200 | ) | (0.49 | ) | |||||||||||||||||||||||
| Adjusted results (Non-GAAP) | $ | 2,795 | $ | 2,227 | $ | 528 | $ | 1,659 | $ | 4.12 | ||||||||||||||||||||
| Quarter Ended | ||||||||||||||||||||||||||||||
| ($ millions, except per share amounts) | September 30, 2017 | |||||||||||||||||||||||||||||
| Earnings from | Net Earnings | |||||||||||||||||||||||||||||
| Continuing | from Continuing | |||||||||||||||||||||||||||||
| Operations | Operations | Diluted EPS | ||||||||||||||||||||||||||||
| Operating | Before Provision | Provision for | Attributable to | from Continuing | ||||||||||||||||||||||||||
| Income | for Income Taxes | Income Taxes (1) | Viacom | Operations | ||||||||||||||||||||||||||
| Reported results (GAAP) | $ | 705 | $ | 571 | $ | (124 | ) | $ | 674 | $ | 1.67 | |||||||||||||||||||
| Factors Affecting Comparability: | ||||||||||||||||||||||||||||||
| Gain on asset sale (8) | (127 | ) | (127 | ) | (20 | ) | (96 | ) | (0.24 | ) | ||||||||||||||||||||
| Discrete tax benefit (3) | - | - | 268 | (268 | ) | (0.66 | ) | |||||||||||||||||||||||
| Adjusted results (Non-GAAP) | $ | 578 | $ | 444 | $ | 124 | $ | 310 | $ | 0.77 | ||||||||||||||||||||
| Year Ended | ||||||||||||||||||||||||||||||
| ($ millions, except per share amounts) | September 30, 2017 | |||||||||||||||||||||||||||||
| Earnings from | Net Earnings | |||||||||||||||||||||||||||||
| Continuing | from Continuing | |||||||||||||||||||||||||||||
| Operations | Operations | Diluted EPS | ||||||||||||||||||||||||||||
| Operating | Before Provision | Provision for | Attributable to | from Continuing | ||||||||||||||||||||||||||
| Income | for Income Taxes | Income Taxes (1) | Viacom | Operations | ||||||||||||||||||||||||||
| Reported results (GAAP) | $ | 2,489 | $ | 2,212 | $ | 293 | $ | 1,871 | $ | 4.67 | ||||||||||||||||||||
| Factors Affecting Comparability: | ||||||||||||||||||||||||||||||
| Restructuring and programming charges (7) | 381 | 381 | 135 | 246 | 0.61 | |||||||||||||||||||||||||
| Gain on asset sale (8) | (127 | ) | (412 | ) | (116 | ) | (285 | ) | (0.71 | ) | ||||||||||||||||||||
| Loss on extinguishment of debt (4) | - | 20 | 7 | 13 | 0.03 | |||||||||||||||||||||||||
| Investment impairment (6) | - | 10 | 4 | 6 | 0.01 | |||||||||||||||||||||||||
| Discrete tax benefit (3) | - | - | 340 | (340 | ) | (0.84 | ) | |||||||||||||||||||||||
| Adjusted results (Non-GAAP) | $ | 2,743 | $ | 2,211 | $ | 663 | $ | 1,511 | $ | 3.77 | ||||||||||||||||||||
(1) The tax impact has been calculated by applying the tax rates applicable to the adjustments presented.
(2) During 2018, we launched a program of cost transformation initiatives to improve our margins, including an organizational realignment of support functions across Media Networks, new sourcing and procurement policies, real estate consolidation and technology enhancements. We recognized pre-tax restructuring and related costs of $25 million and $225 million in the quarter and year ended September 30, 2018, respectively.
(3) The net discrete tax benefit in the quarter ended September 30, 2018 was principally related to the recognition of certain loss carryforwards. In addition to the items in the quarter, the net discrete tax benefit in the year ended September 30, 2018 was principally related to tax reform, as well as a tax accounting method change granted by the Internal Revenue Service.
The net discrete tax benefit in the quarter ended September 30, 2017 was principally related to the recognition of foreign tax credits realized on the distribution of certain securities to Viacom’s U.S. group. In addition to the items in the quarter, the net discrete tax benefit in the year ended September 30, 2017 included the reversal of a valuation allowance on capital loss carryforwards in connection with the sale of our investment in EPIX and the release of tax reserves with respect to certain effectively settled tax positions.
(4) We redeemed senior notes and debentures totaling $1.039 billion in the year ended September 30, 2018. As a result, we recognized a pre-tax extinguishment gain of $25 million.
We redeemed senior notes and debentures totaling $3.3 billion in the year ended September 30, 2017, As a result, we recognized a pre-tax extinguishment loss of $20 million.
(5) We completed the sale of a 1% equity interest in Viacom18 to our joint venture partner for $20 million, resulting in a gain of $16 million in the year ended September 30, 2018.
(6) We recognized impairment losses of $46 million in the year ended September 30, 2018 and $10 million in the year ended September 30, 2017 resulting from the write-off of certain cost method investments.
(7) We recognized pre-tax restructuring and programming charges of $381 million in the year ended September 30, 2017, reflecting $237 million of restructuring charges and $144 million of programming charges resulting from the execution of our flagship brand strategy and strategic initiatives at Paramount.
(8) In the quarter and year ended September 30, 2017, a consolidated entity completed the sale of broadcast spectrum in connection with the FCC’s broadcast spectrum auction. The sale resulted in a pre-tax gain of $127 million, with $11 million attributable to the noncontrolling interest. We also completed the sale of our 49.76% interest in EPIX in the year ended September 30, 2017, resulting in a pre-tax gain of $285 million.
The following table reconciles our net cash provided by operating activities (GAAP) for the quarter and year ended September 30, 2018 and 2017 to free cash flow and operating free cash flow (non-GAAP). We define free cash flow as net cash provided by operating activities minus capital expenditures, as applicable. We define operating free cash flow as free cash flow, excluding the impact of the cash premium on the extinguishment of debt, as applicable. Free cash flow and operating free cash flow are non-GAAP measures. Management believes the use of these measures provides investors with an important perspective on, in the case of free cash flow, our liquidity, including our ability to service debt and make investments in our businesses, and, in the case of operating free cash flow, our liquidity from ongoing activities.
Reconciliation of net cash provided by operating activities | Quarter Ended September 30, | Better/ (Worse) | Year Ended | Better/ (Worse) | ||||||||||||||||||||||||||||||||
| 2018 | 2017 | $ | 2018 | 2017 | $ | |||||||||||||||||||||||||||||||
| Net cash provided by operating activities (GAAP) | $ | 825 | $ | 1,018 | $ | (193 | ) | $ | 1,822 | $ | 1,672 | $ | 150 | |||||||||||||||||||||||
| Capital expenditures | (76 | ) | (56 | ) | (20 | ) | (178 | ) | (195 | ) | 17 | |||||||||||||||||||||||||
| Free cash flow (Non-GAAP) | 749 | 962 | (213 | ) | 1,644 | 1,477 | 167 | |||||||||||||||||||||||||||||
| Debt retirement premium | - | - | - | - | 33 | (33 | ) | |||||||||||||||||||||||||||||
| Operating free cash flow (Non-GAAP) | $ | 749 | $ | 962 | $ | (213 | ) | $ | 1,644 | $ | 1,510 | $ | 134 | |||||||||||||||||||||||
View source version on businesswire.com: https://www.businesswire.com/news/home/20181116005159/en/
Contacts:
Justin Dini
Senior
Vice President, Corporate Communications
(212) 846-2724
justin.dini@viacom.com
