Retail sales are still holding up, with a more-than-expected climb in December, boosted by online purchases. This has caused economists to upgrade their economic growth projections. Coupled with robust employment and wage gains, this has erased fears about an economic recession.
Credit card giant Visa Inc. (V), which will report its fiscal first-quarter financial results tomorrow, shrugged off the cost of living crisis in the last-reported quarter when its payment volumes rose 9% for the quarterly period. Moreover, although moderating inflation could hurt card companies, as it is well off its peak, it should not be a headwind for Visa.
On top of it, the company is expanding its operations. This month, it completed the acquisition of Pismo, a global cloud-native issuer processing and core banking platform. V also declared the launch of its Visa Web3 Loyalty Engagement Solution, aiding in its digital customer engagement.
In light of this situation, let’s look at the trends of V’s key financial metrics to understand why the stock could be a solid buy now.
Analyzing Visa Inc.'s Financial Performance Metrics from March 2021 to September 2023
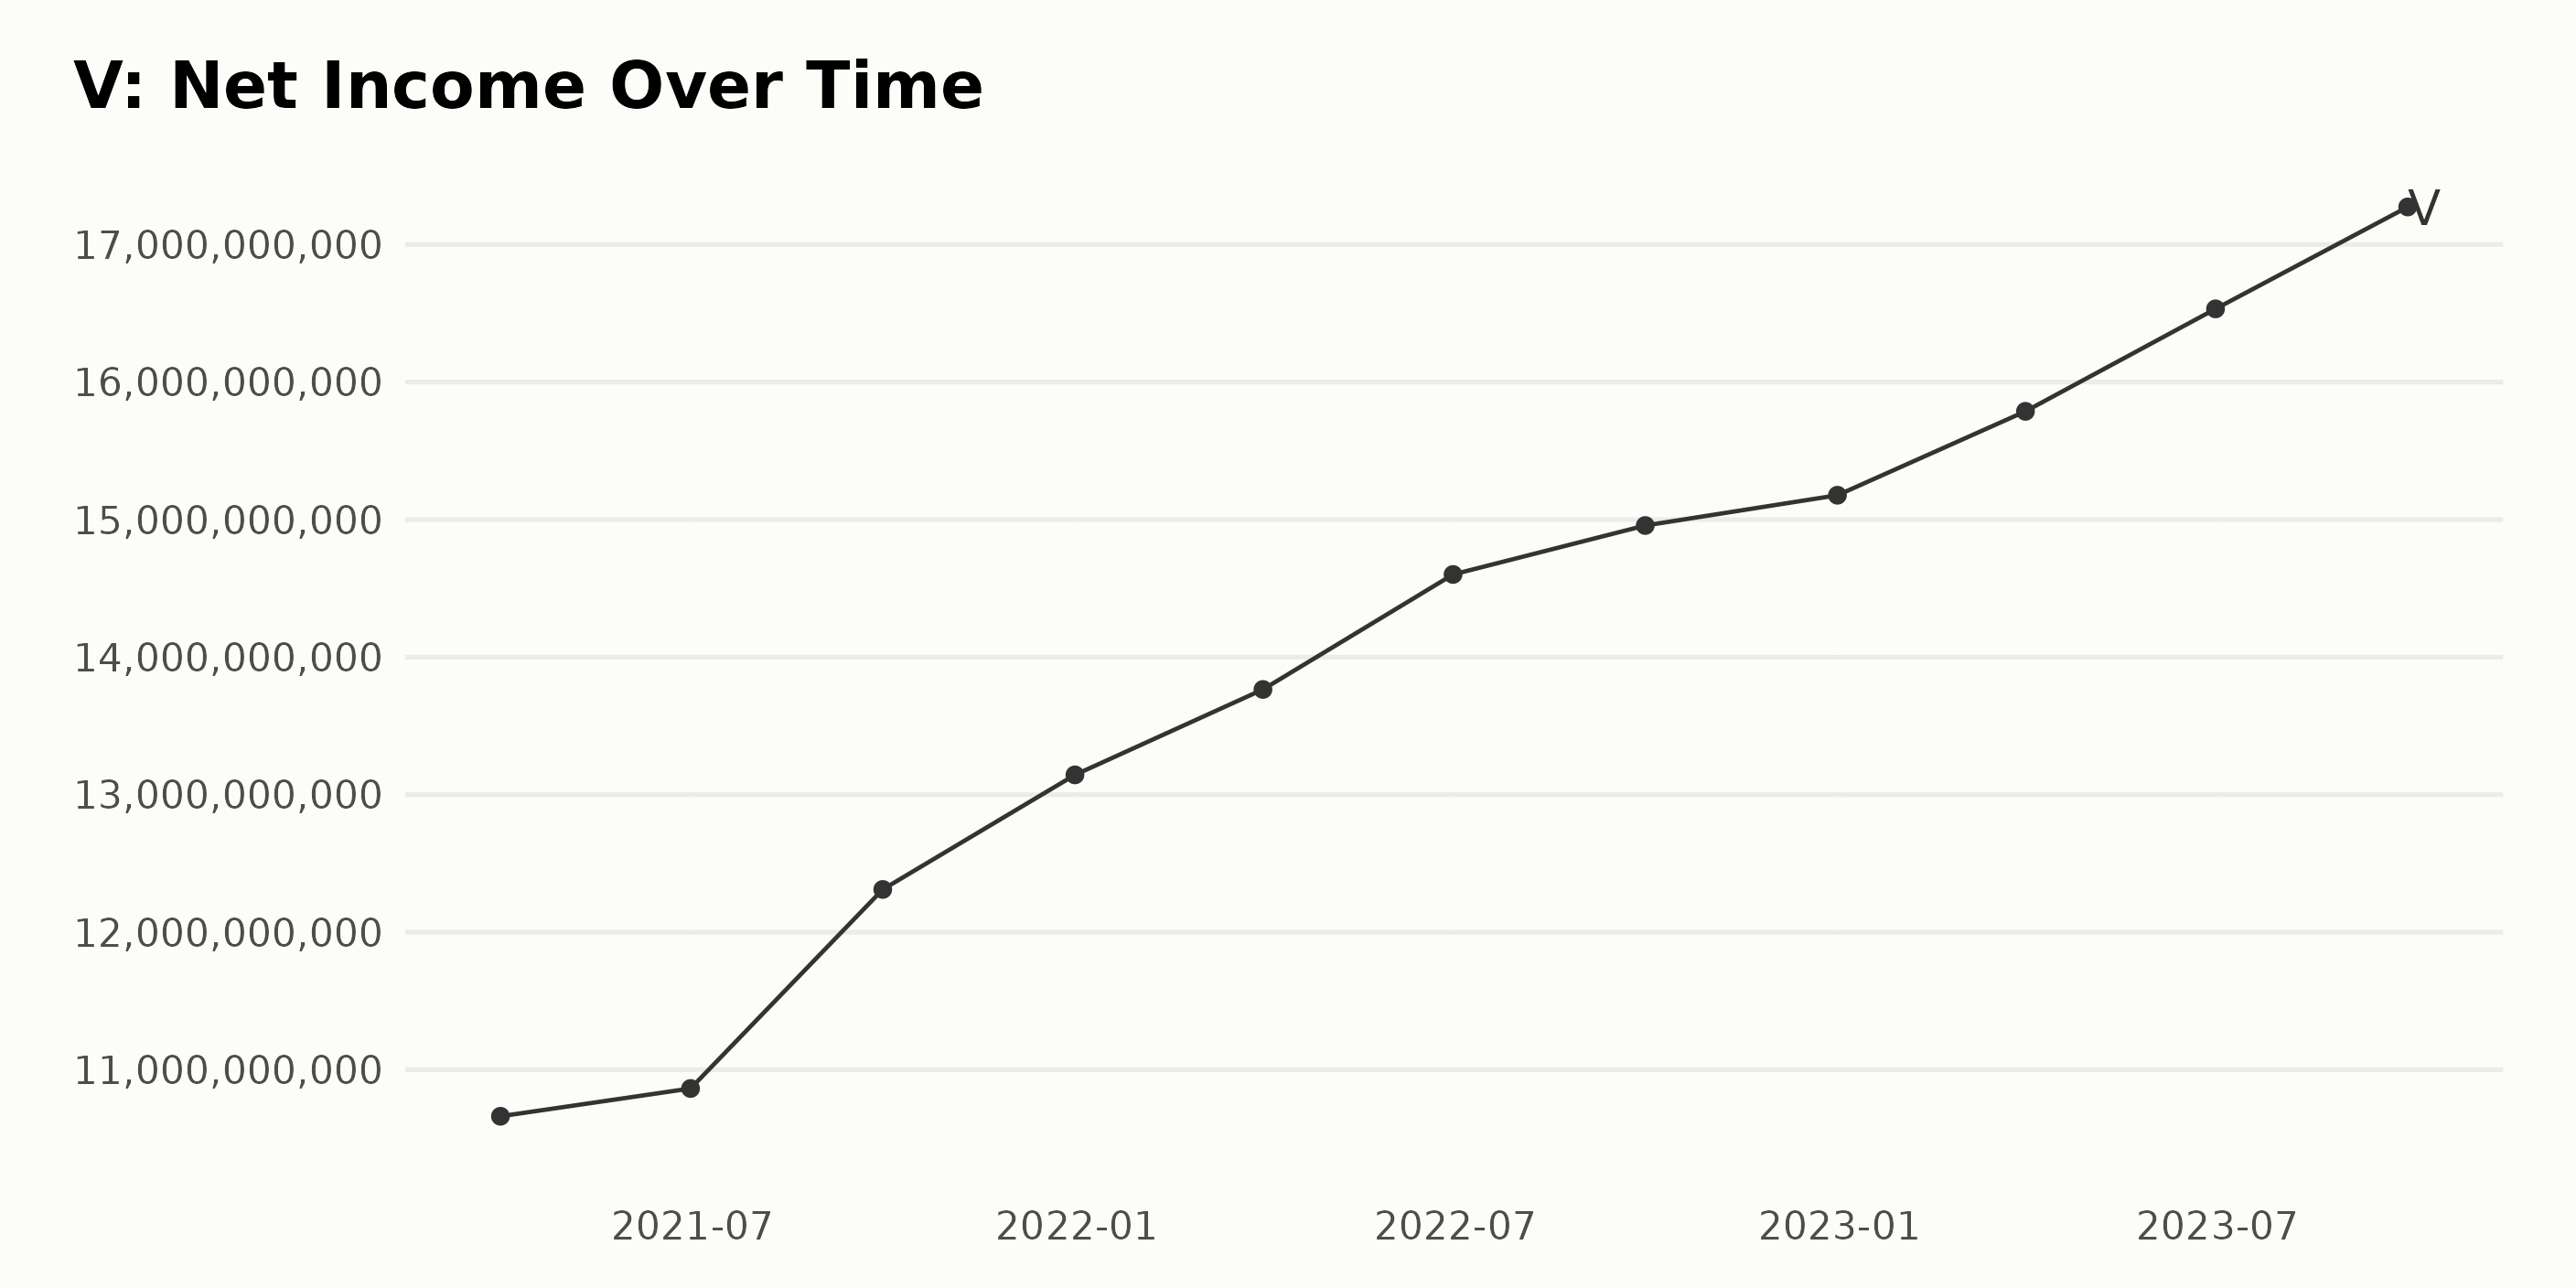
The trailing-12-month net income of V has demonstrated a consistent upward trend over the timeframe from March 2021 to September 2023, showing increased financial stability and growth of the company. Notable observations include:
- At the beginning of the series in March 2021, V's net income started at $10.66 billion.
- There was a noticeable increase in net income across consecutive quarters throughout 2021, ending the year with a value of $13.14 billion in December.
- The growth further accelerated into 2022, commencing with $13.77 billion in March and finishing the year at $15.18 billion in December.
- The first quarter of 2023 opened with a net income of $15.79 billion. The growth remained robust across the year, with the figure standing at $17.27 billion by the end of September 2023.
By comparing the first value ($10.66 billion in March 2021) with the last value ($17.27 billion in September 2023), we see an increase of approximately $6.61 billion. This suggests consistent growth in net income over the period.
In summary, Visa has shown a strong and steady increase in net income over the period, with a significant uptick starting from 2022 and into 2023. The growth rate based on the values between March 2021 and September 2023 is quite promising, indicating healthy financial performance.
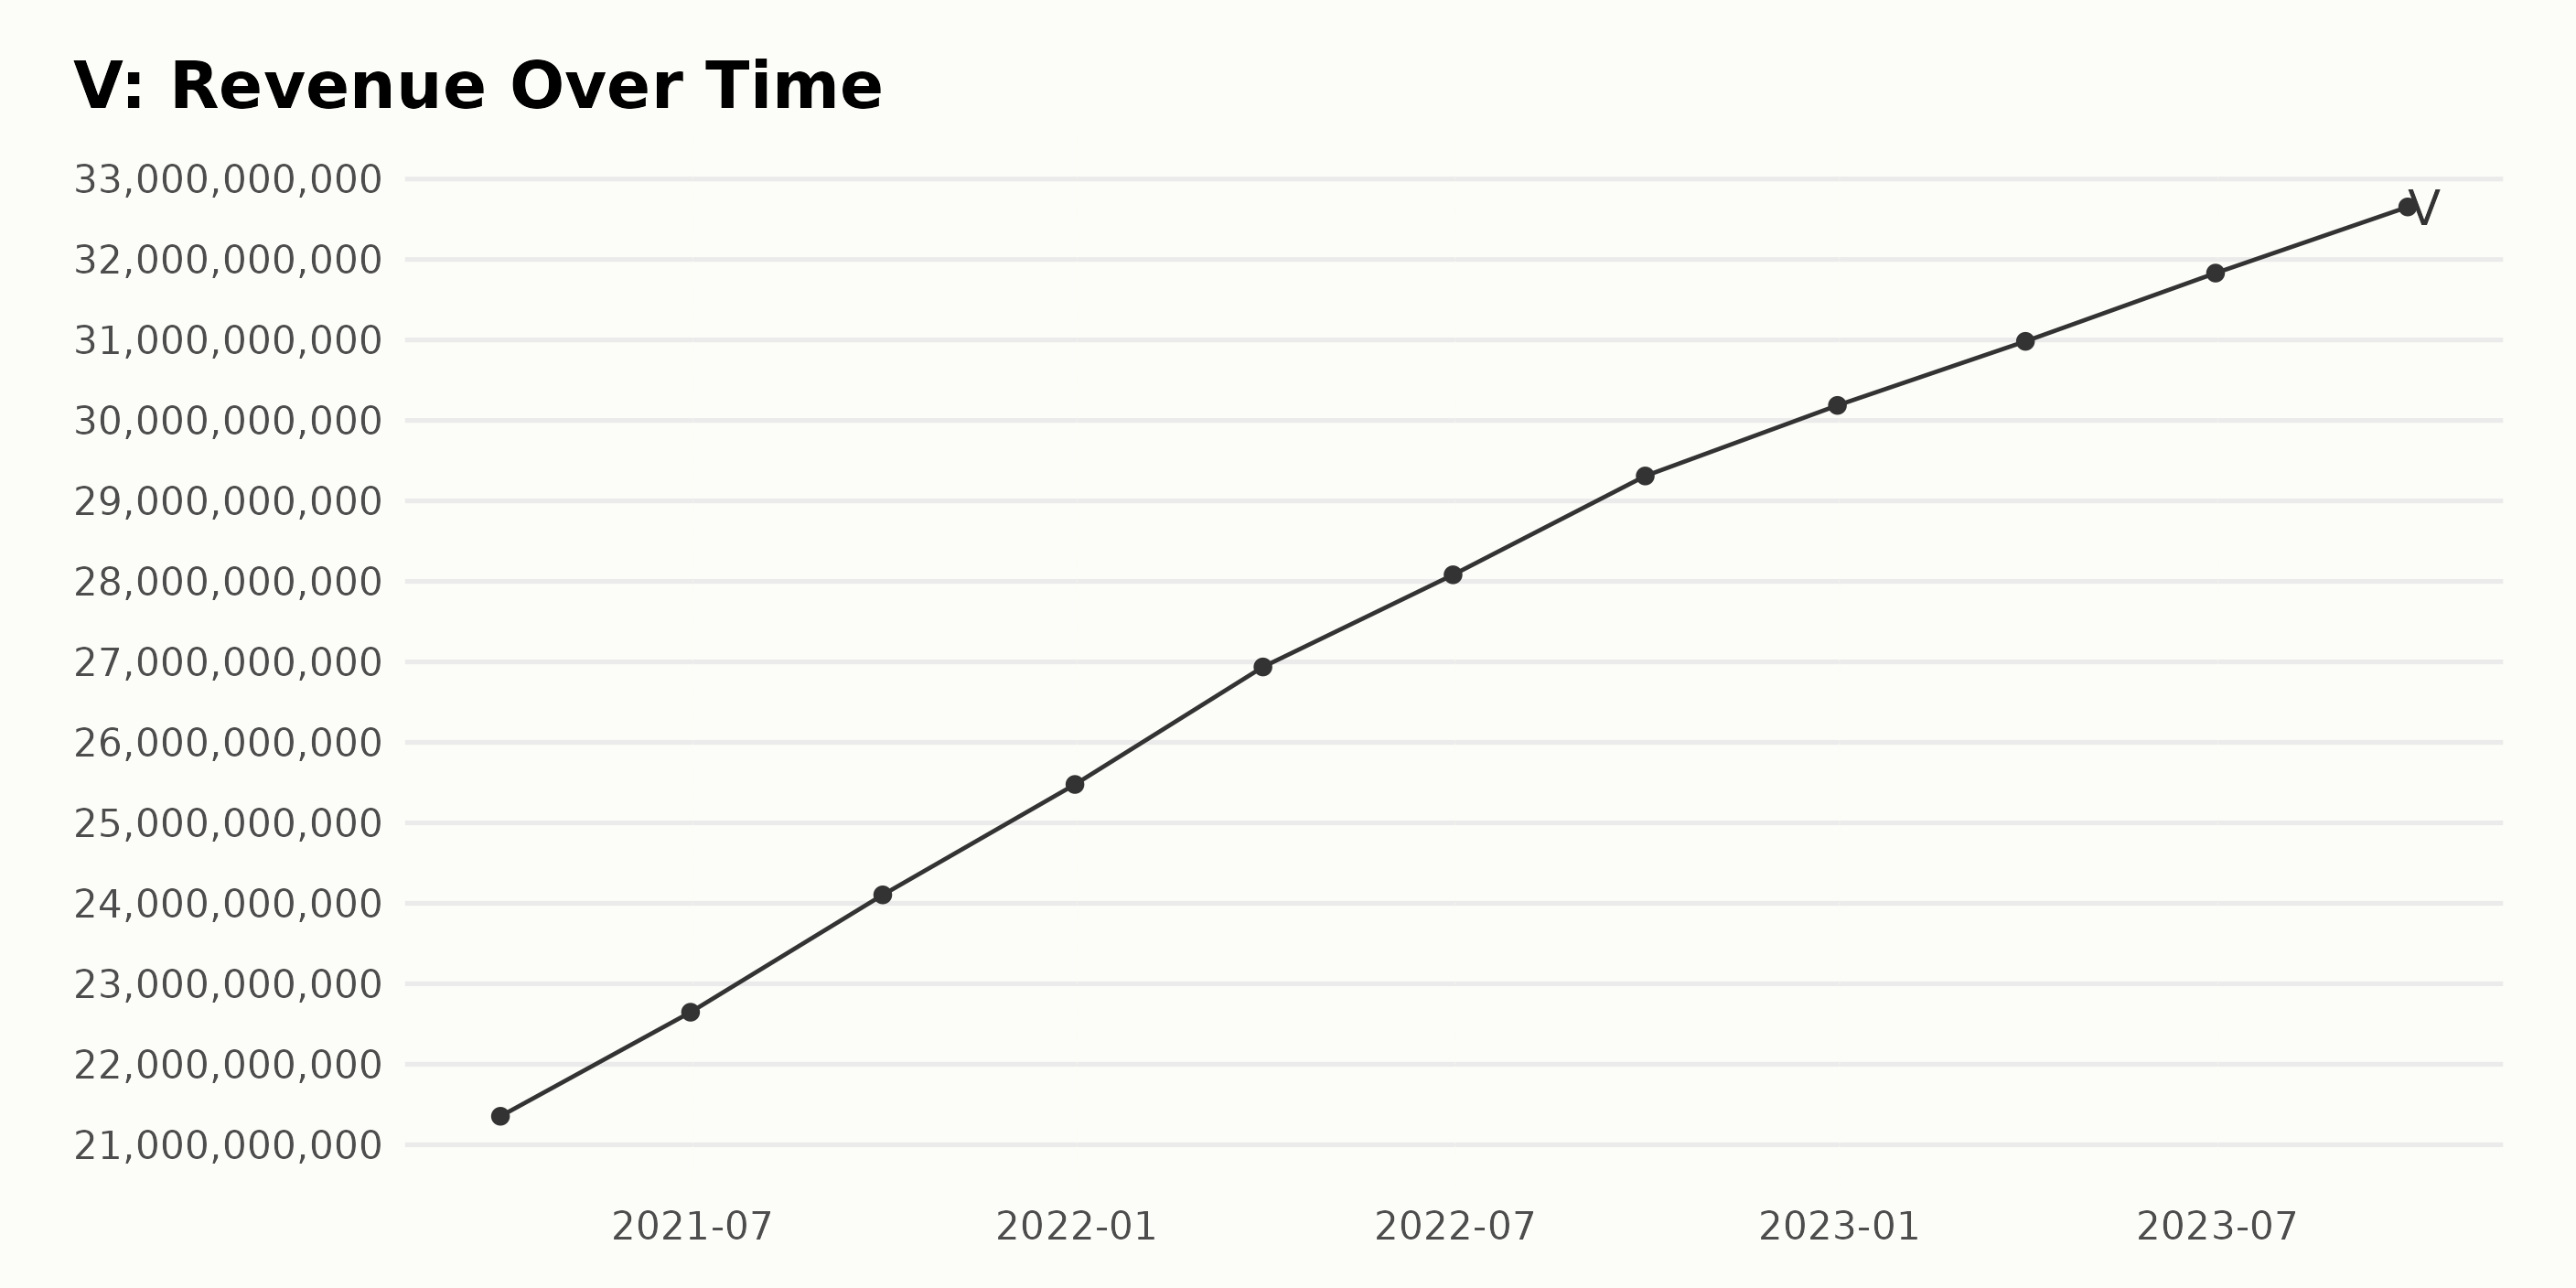
V’s trailing-12-month revenue showed consistent growth over the analyzed period, ranging from March 2021 to September 2023, suggesting an upward trend. The company's revenue fluctuated as it steadily rose across this span of time. Here’s a summary in chronological order, with emphasis on the most recent data:
- As of March 31, 2021, Visa's revenue was $21.35 billion.
- In June 2021, there was an increase, with total revenue hitting $22.65 billion.
- By the end of September 2021, the upward trend continued, and the revenue rose to $24.11 billion.
- The trend carried over to December 31, 2021, at a revenue of $25.48 billion.
- In March 2022, the revenues touched $26.94 billion, which was a marked hike.
- As of June 30, 2022, the figures rose yet again, this time to $28.08 billion.
- By September 30, 2022, Visa's revenue had reached $29.31 billion.
- This trend was maintained by the end of December 2022, when the revenue capped off at $30.19 billion.
- In the first quarter of 2023, specifically at the end of March, a further increase occurred, with revenues reaching $30.98 billion.
- Subsequently, on June 30, 2023, Visa's revenue stretched further to $31.83 billion.
The last value in the data series available, dated September 30, 2023, reports Visa's revenue as $32.65 billion. Between March 2021 and September 2023, Visa's revenue demonstrates an overall growth rate of about 53%, signifying a constant appreciation.
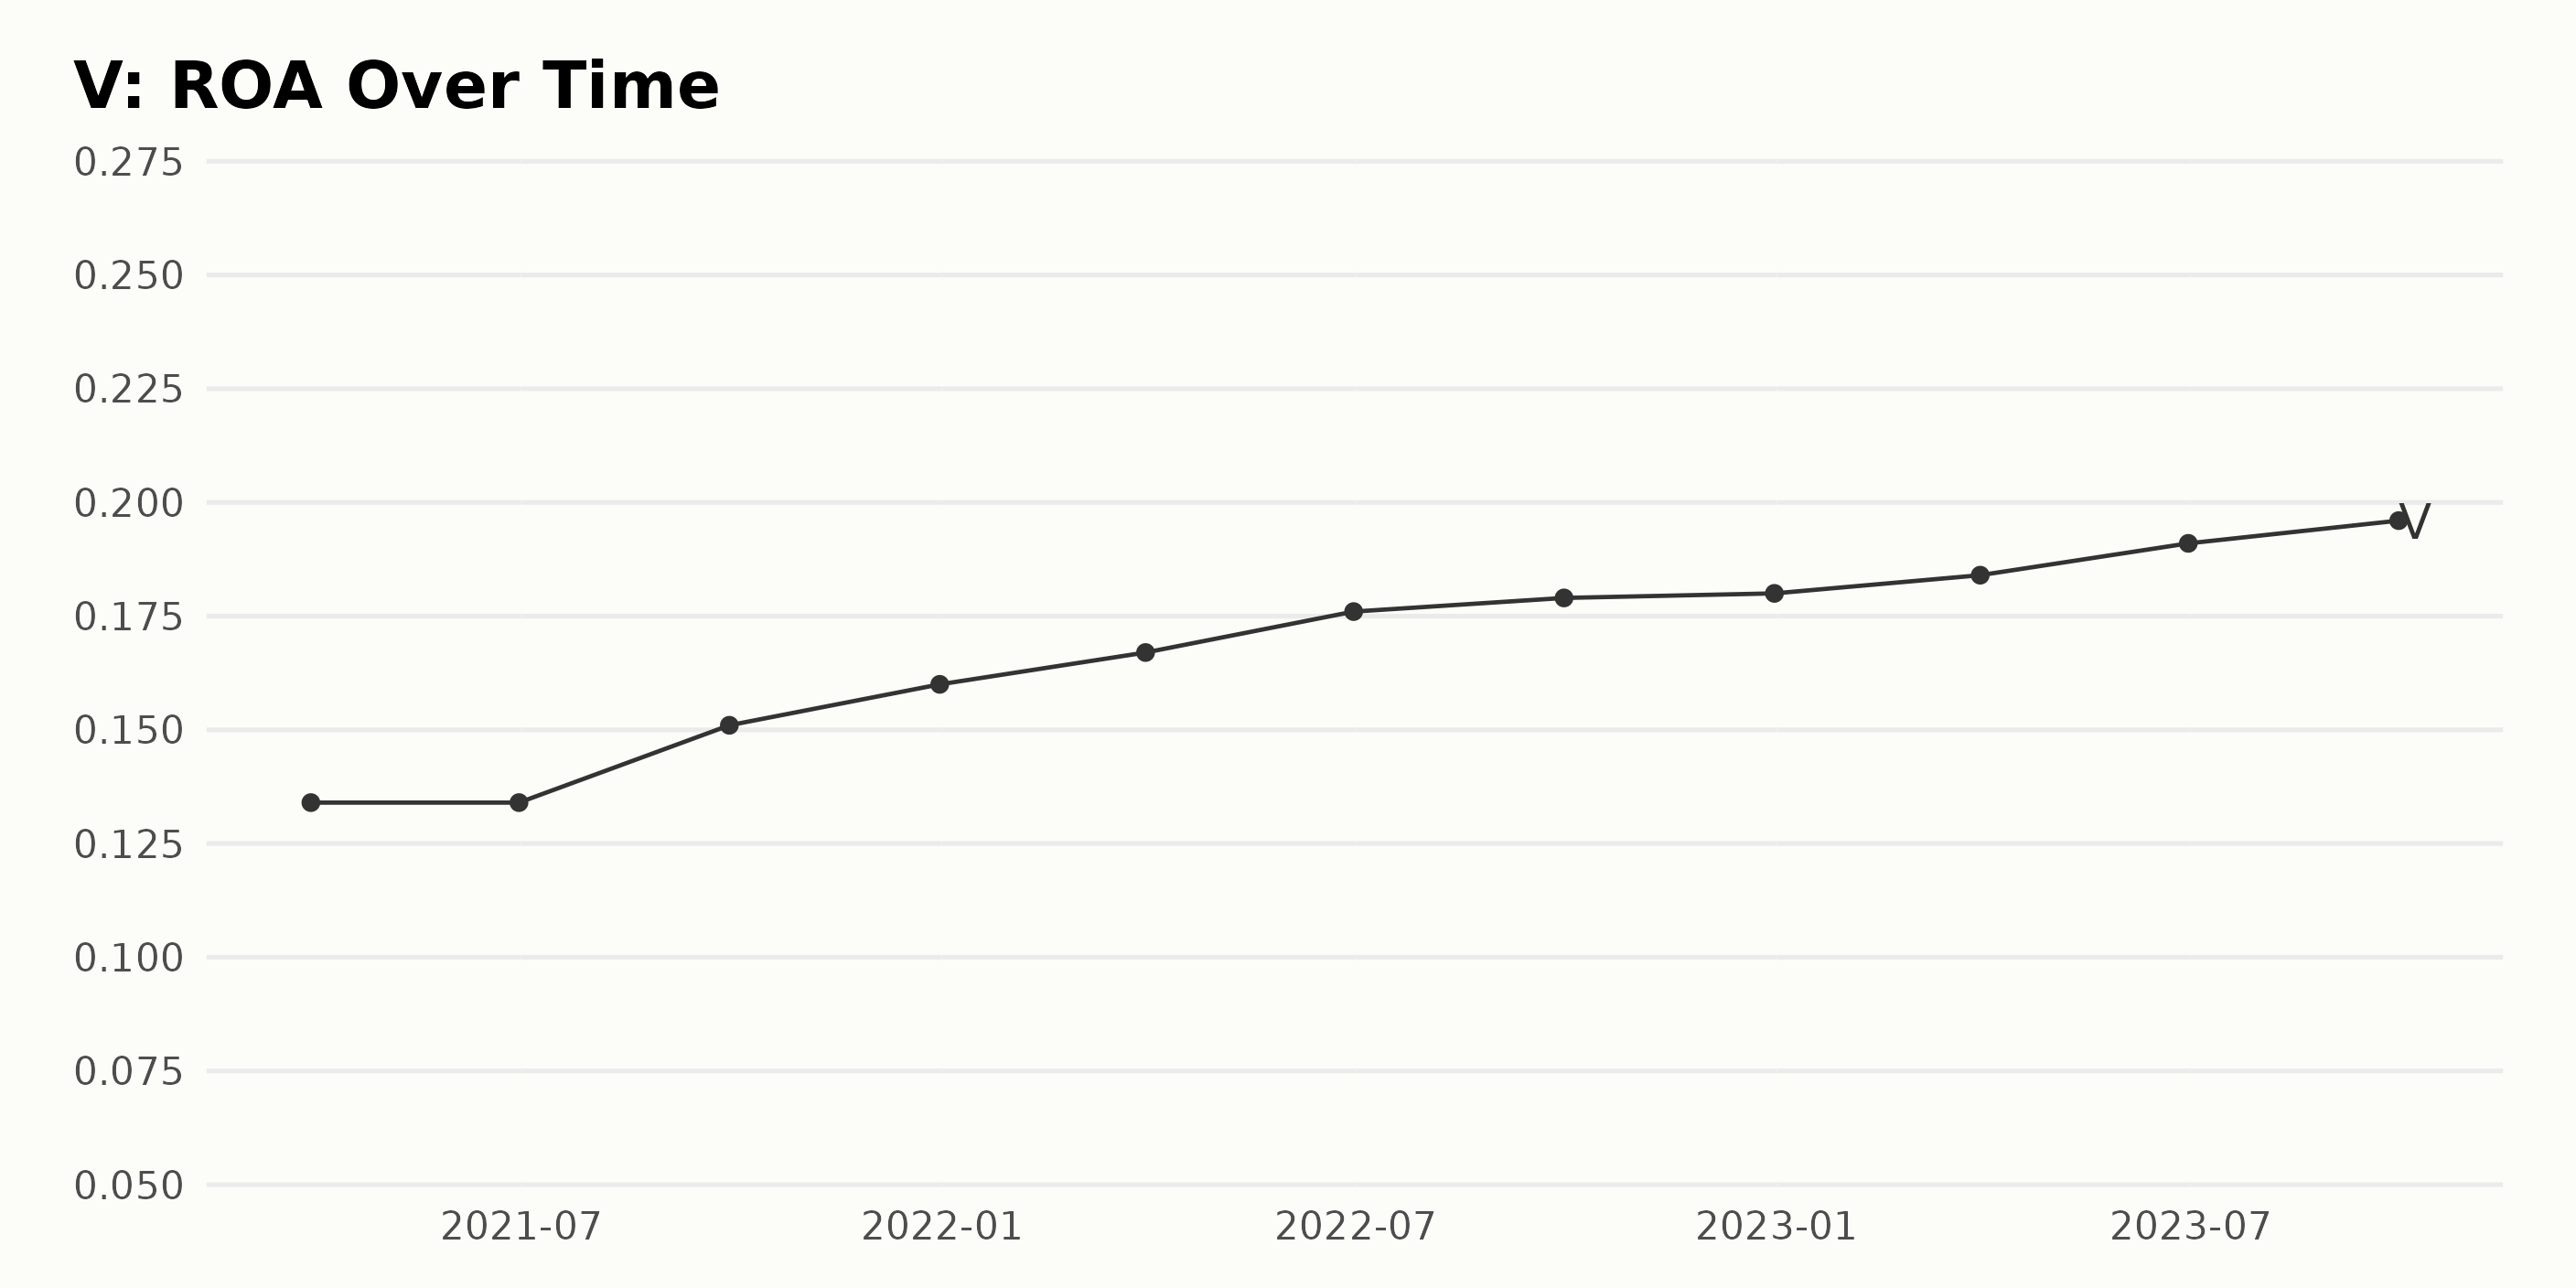
Analyzing the data series of V’s Return On Assets (ROA) reveals a clearly discernible upward trend, epitomized by gradual and consistent growth over the period from March 31, 2021, to September 30, 2023. Specific points of interest include:
- Starting from 0.134 on March 31, 2021, the ROA remained constant until the end of June 2021.
- A significant increase was observed as of September 30, 2021, reaching 0.151. The subsequent quarters up till December 31, 2022 saw steady rises with the values ranging from 0.16 to 0.18.
- From March 31, 2023 to June 30, 2023, the ROA experienced an incremental jump from 0.184 to 0.191
- The highest reported value in the series was on September 30, 2023, when the ROA peaked at 0.196.
Overall, there is a positive growth rate from the beginning to the end of the series, reflecting Visa Inc.'s increasing efficiency in asset utilization. No significant fluctuations are evident within the reported timeframe, pointing toward a stable trajectory of growth for the company's ROA.
Calculating the growth rate from the first (0.134) to the last value (0.196), the increase computes to approximately 46% over two and a half years. This suggests a notable improvement in the company's profitability and financial performance.
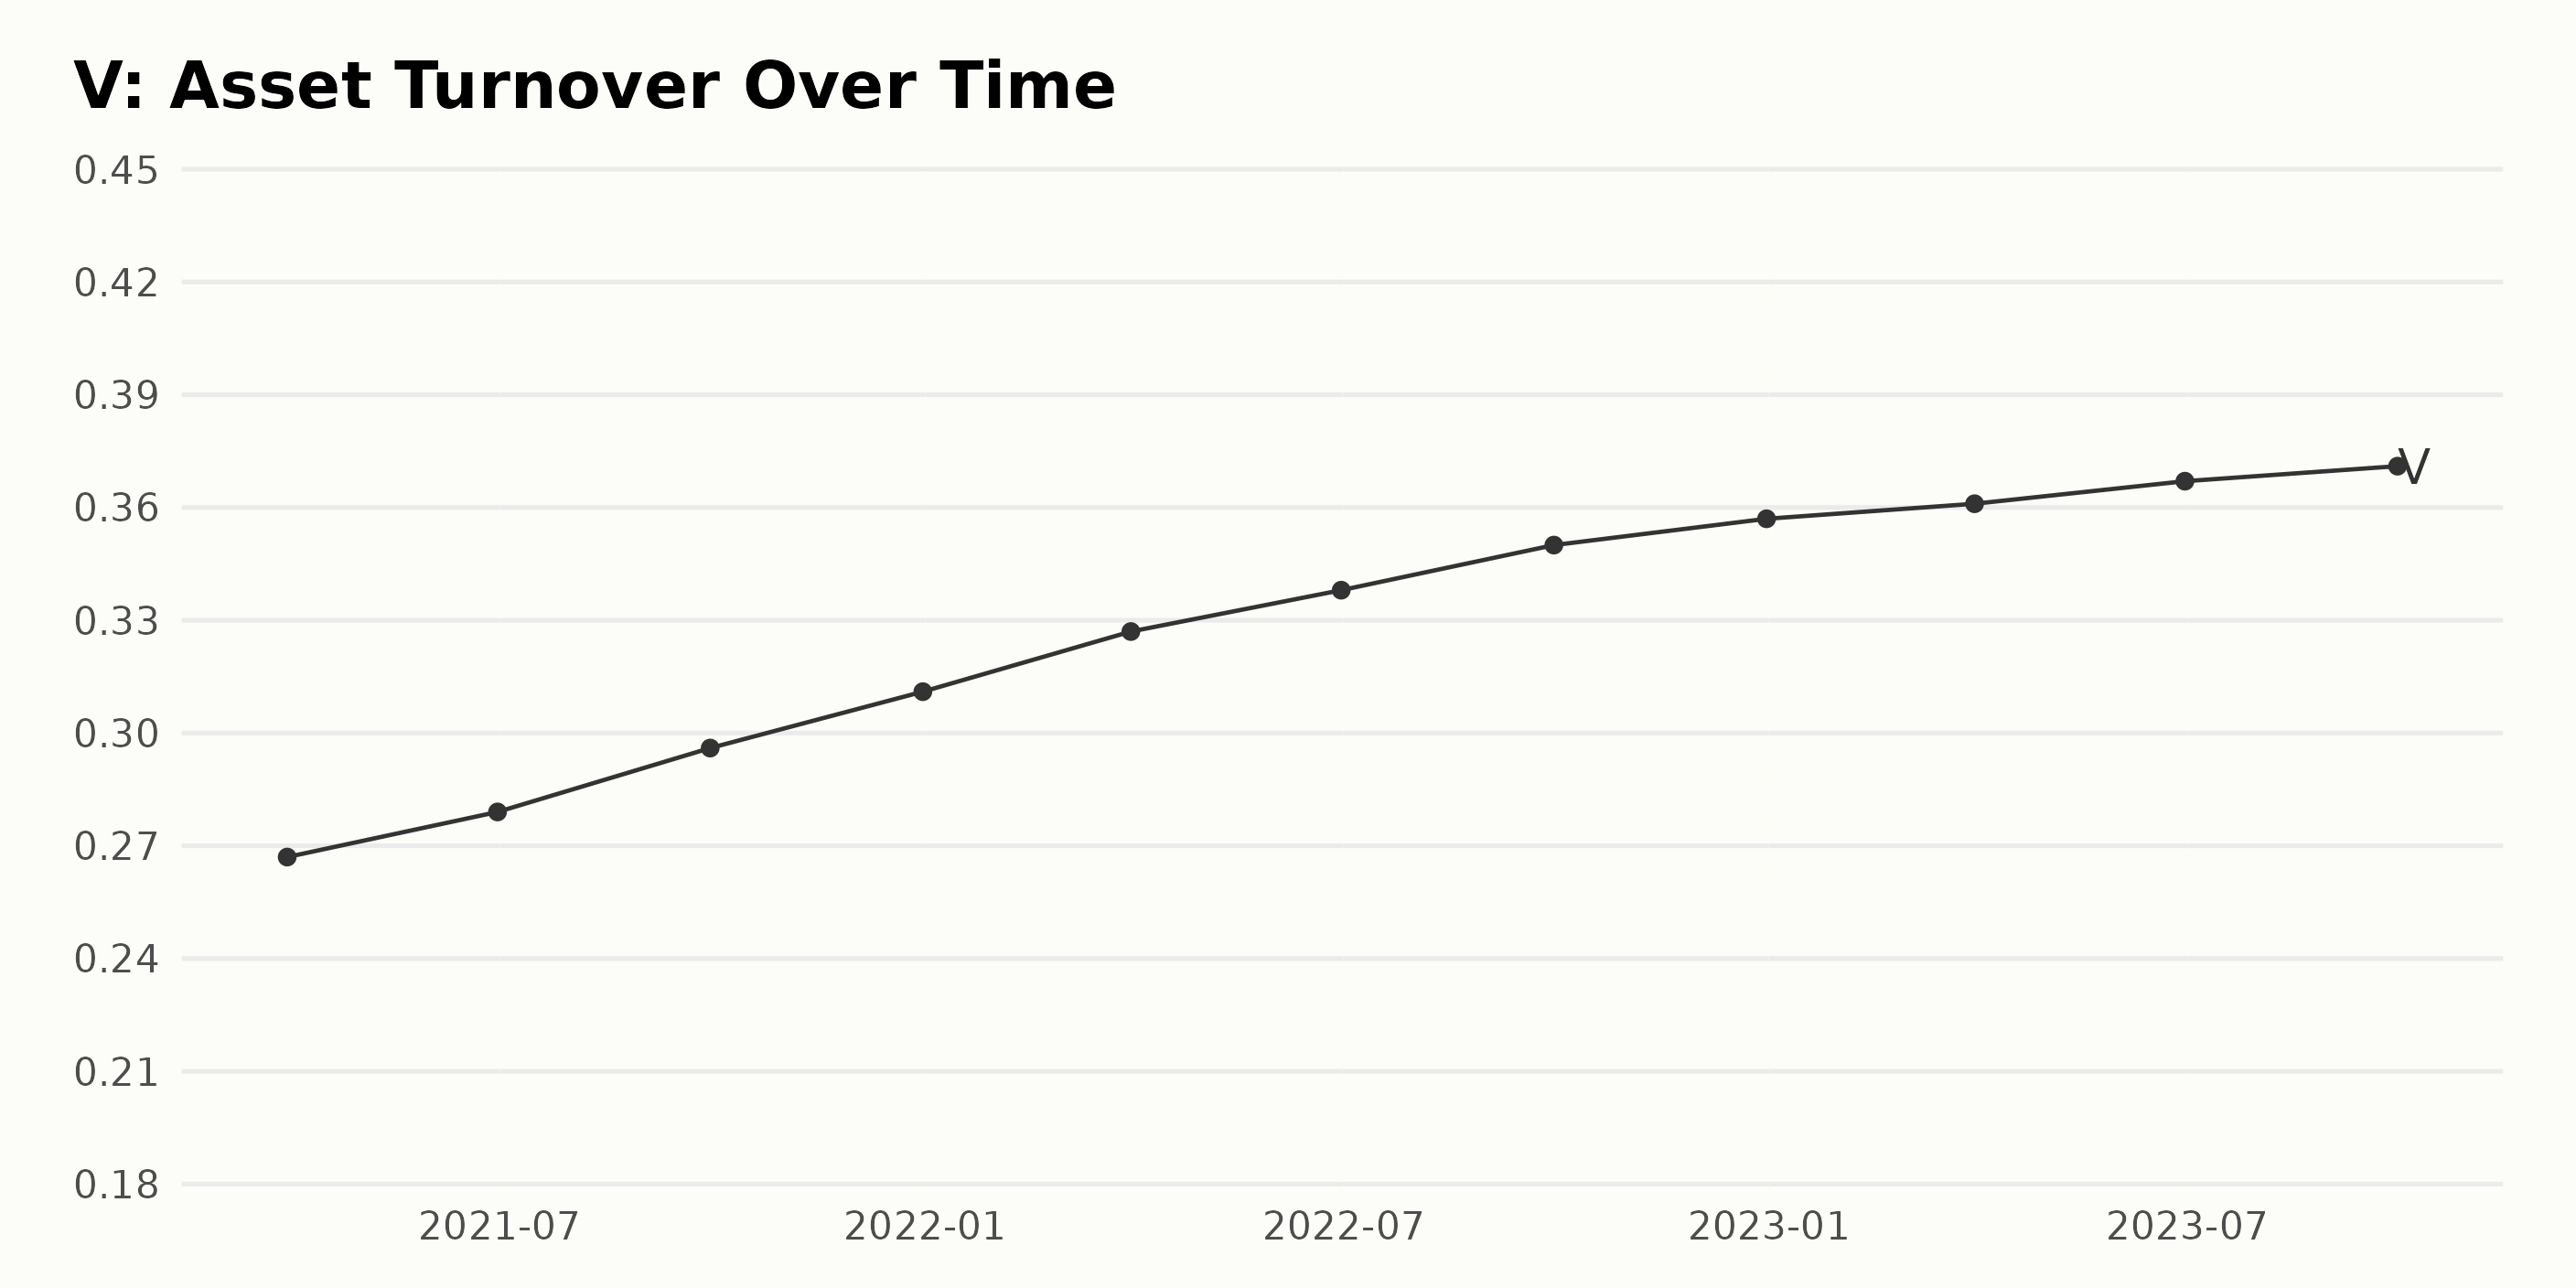
The data series refers to the asset turnover of Visa from March 2021 through September 2023. In review of the series, several trends and fluctuations observed are notably:
- The asset turnover began at 0.267 in March 2021, and by September 2023, it increased to 0.371. This indicates an evident upward trend over this period with a growth rate of around 39%.
- There is a consistent trend of quarter-on-quarter growth in asset turnover. It has grown each quarter from March 2021 to September 2023 without any significant dips.
- Throughout 2022, V saw substantial quarterly growth in asset turnover, starting the year off at 0.311 and finishing it at a slightly higher value of 0.357.
- From the beginning of 2023 to September of that same year, the growth rate appears to decelerate slightly, moving from 0.361 to 0.371.
- The last recorded asset turnover for Visa Inc. is 0.371 in September 2023, which represents the highest point in the series thus far.
These observations indicate a generally positive performance for Visa Inc. in utilizing their assets to generate revenue, with regular growth throughout this timeframe. The slight slowdown in the latter part of the series might suggest a maturation or saturation of their market segment.
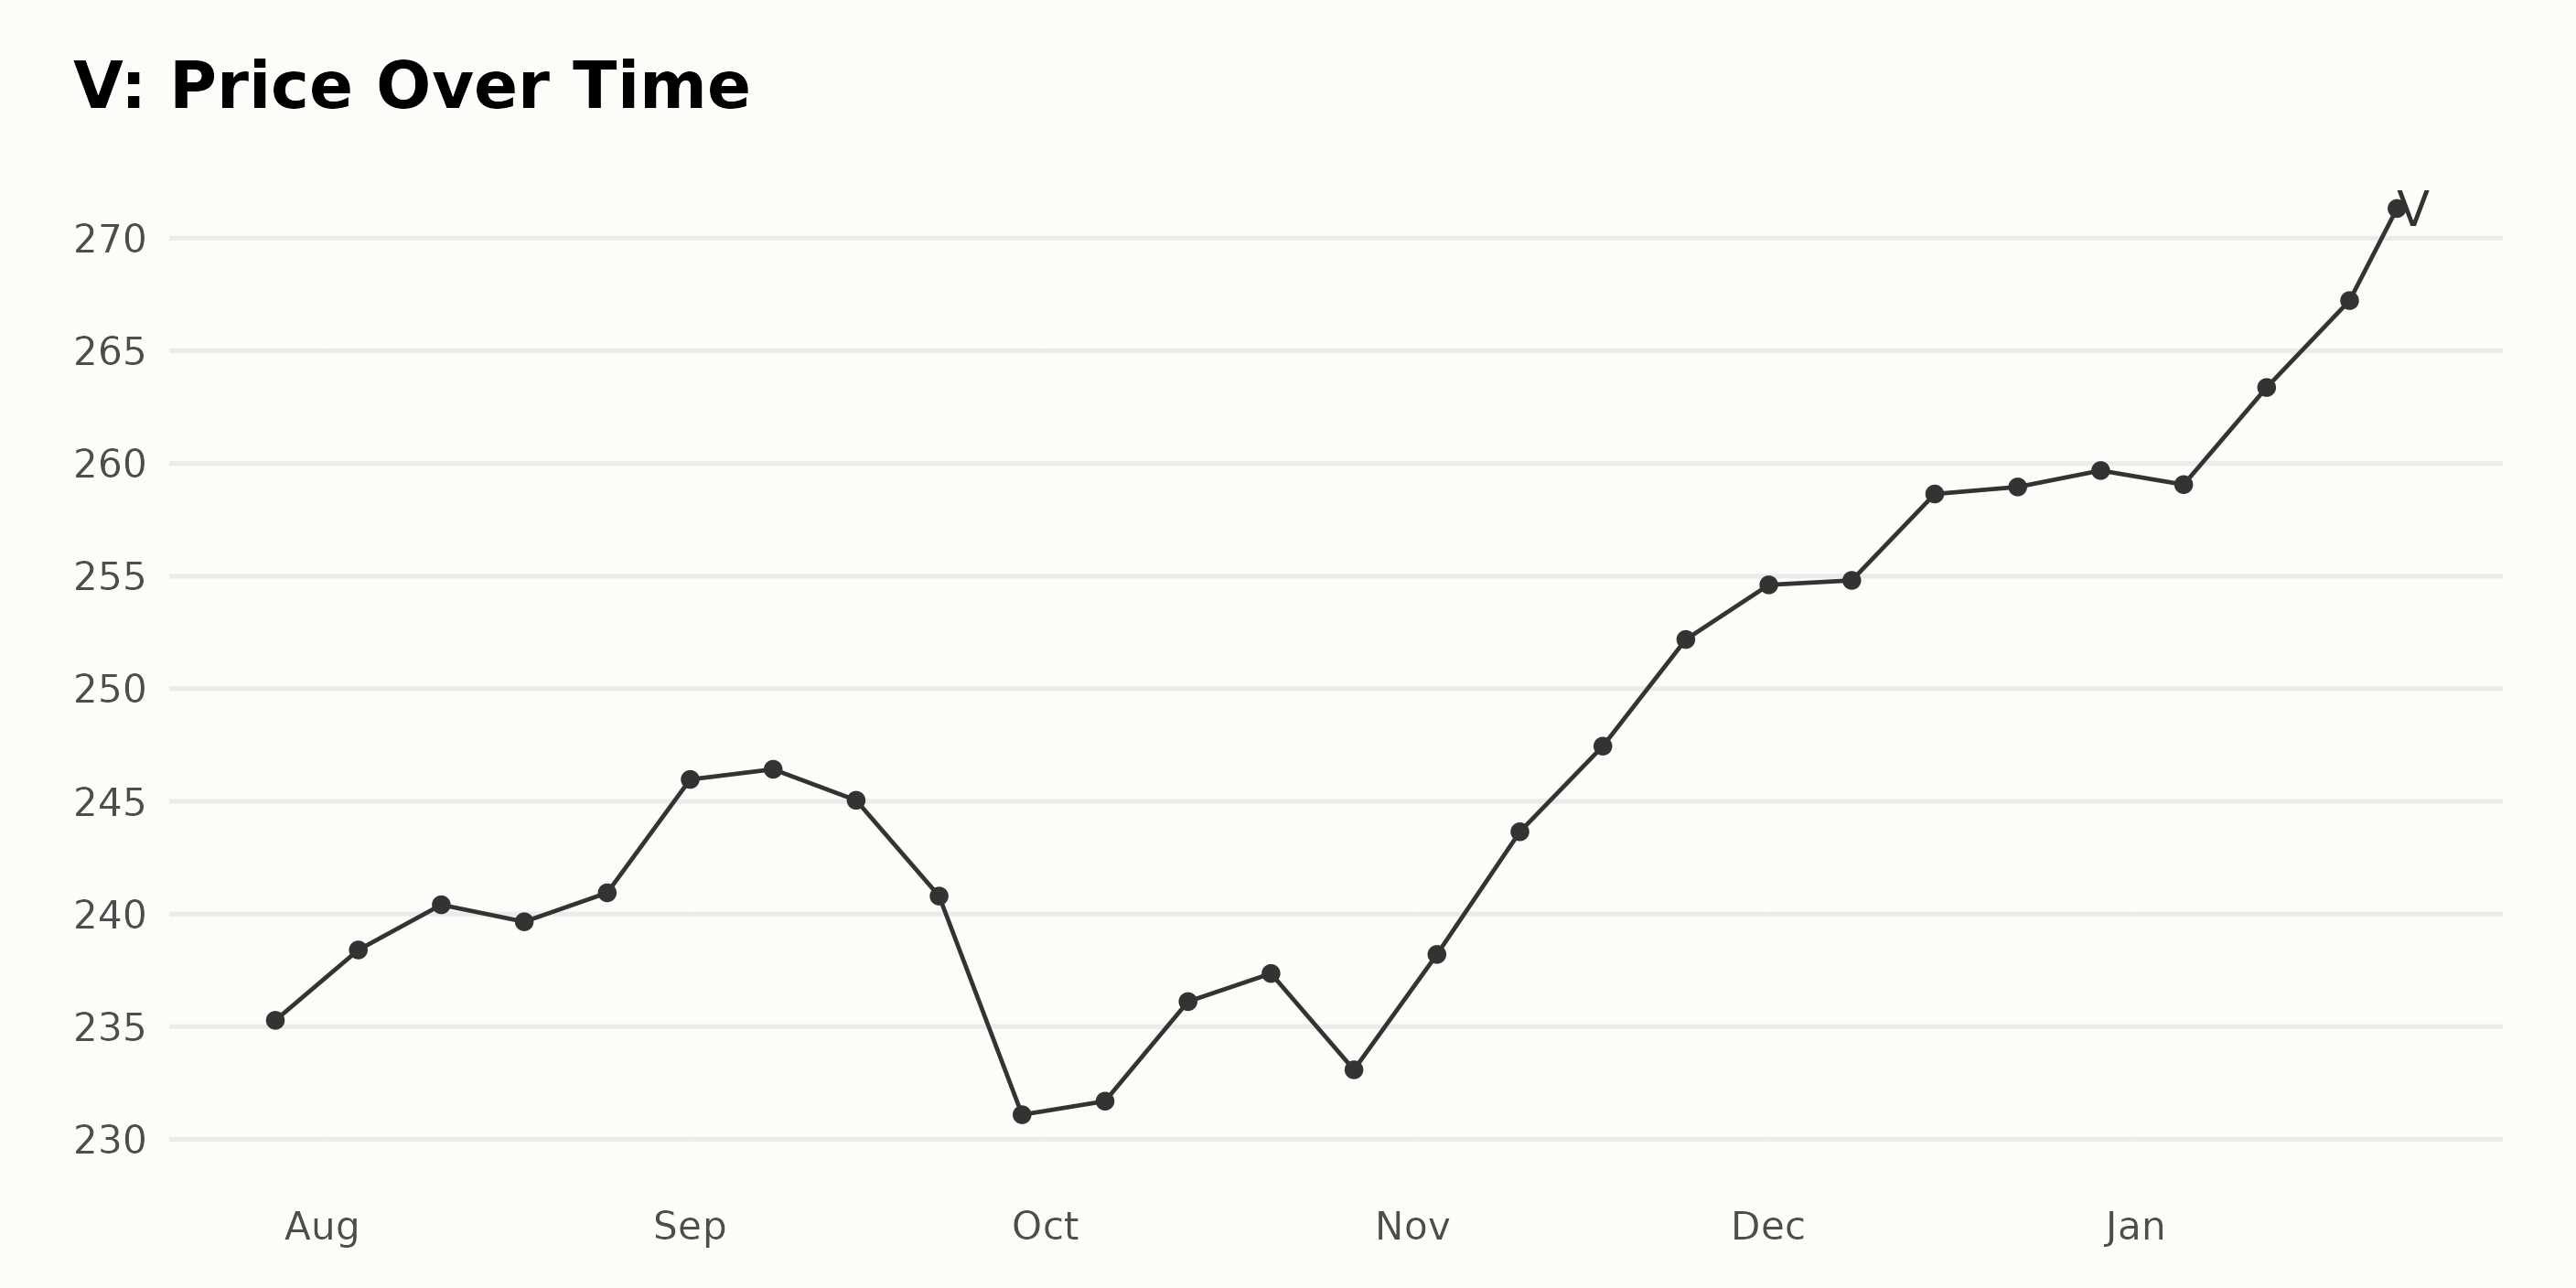
Visa Inc. Stock Analysis: A Six-Month Growth Trend Overview from July 2023 - January 2024
Analyzing the given data carefully, it appears that V has shown a positive and generally ascending trend from late July 2023 to late January 2024. Here's a detailed overview:
- Starting at a share price of $235.28 on July 28, 2023, the value increased slightly over August 2023 and peaked at $240.94 by August 25.
- In September 2023, the share price saw a dip down to $231.09 towards the end of the month, but quickly resumed an upward trajectory in October, reaching $237.36 on October 20, 2023.
- In November 2023, the share price steadily increased, peaking at $252.19 by November 24.
- December 2023 saw a further increase in the share price, ending the year at $259.69.
- The momentum carried into 2024, with the share price hitting its highest point of the observed period at $271.26 by January 23, 2024.
Taking all these observations into account, the data reveals an overall positive growth trend, with some periodic fluctuations that are quite typical in a dynamic market scenario. Here is a chart of V's price over the past 180 days.
Performance Analysis of Visa Inc.'s Quality, Stability, and Momentum Ratings
The latest data available for stock V, which falls within the Consumer Financial Services category, is as of January 12, 2024. The data outlines the following points:
- The POWR Ratings grade for V has consistently maintained a grade of B (Buy) from the week of July 29, 2023, until the latest data.
- In terms of its rank within the category, V has seen shifts throughout this period. As lower values denote superior rank, it reached its best position on August 9, 2023, with a 3rd rank within its category of 46 stocks.
- Since then, its rank has fluctuated between positions 5 and 10 mostly, indicating a stable but not dominating performance within its category.
- As per the latest value from January 24, 2024, V holds a 5th rank in the category, showing a relatively strong standing amongst its peers in the Consumer Financial Services group.
To conclude, stock V has maintained a steady POWR grade of B (Buy) over this analyzed period while showing some ranking fluctuations within its category but remains competitive overall.
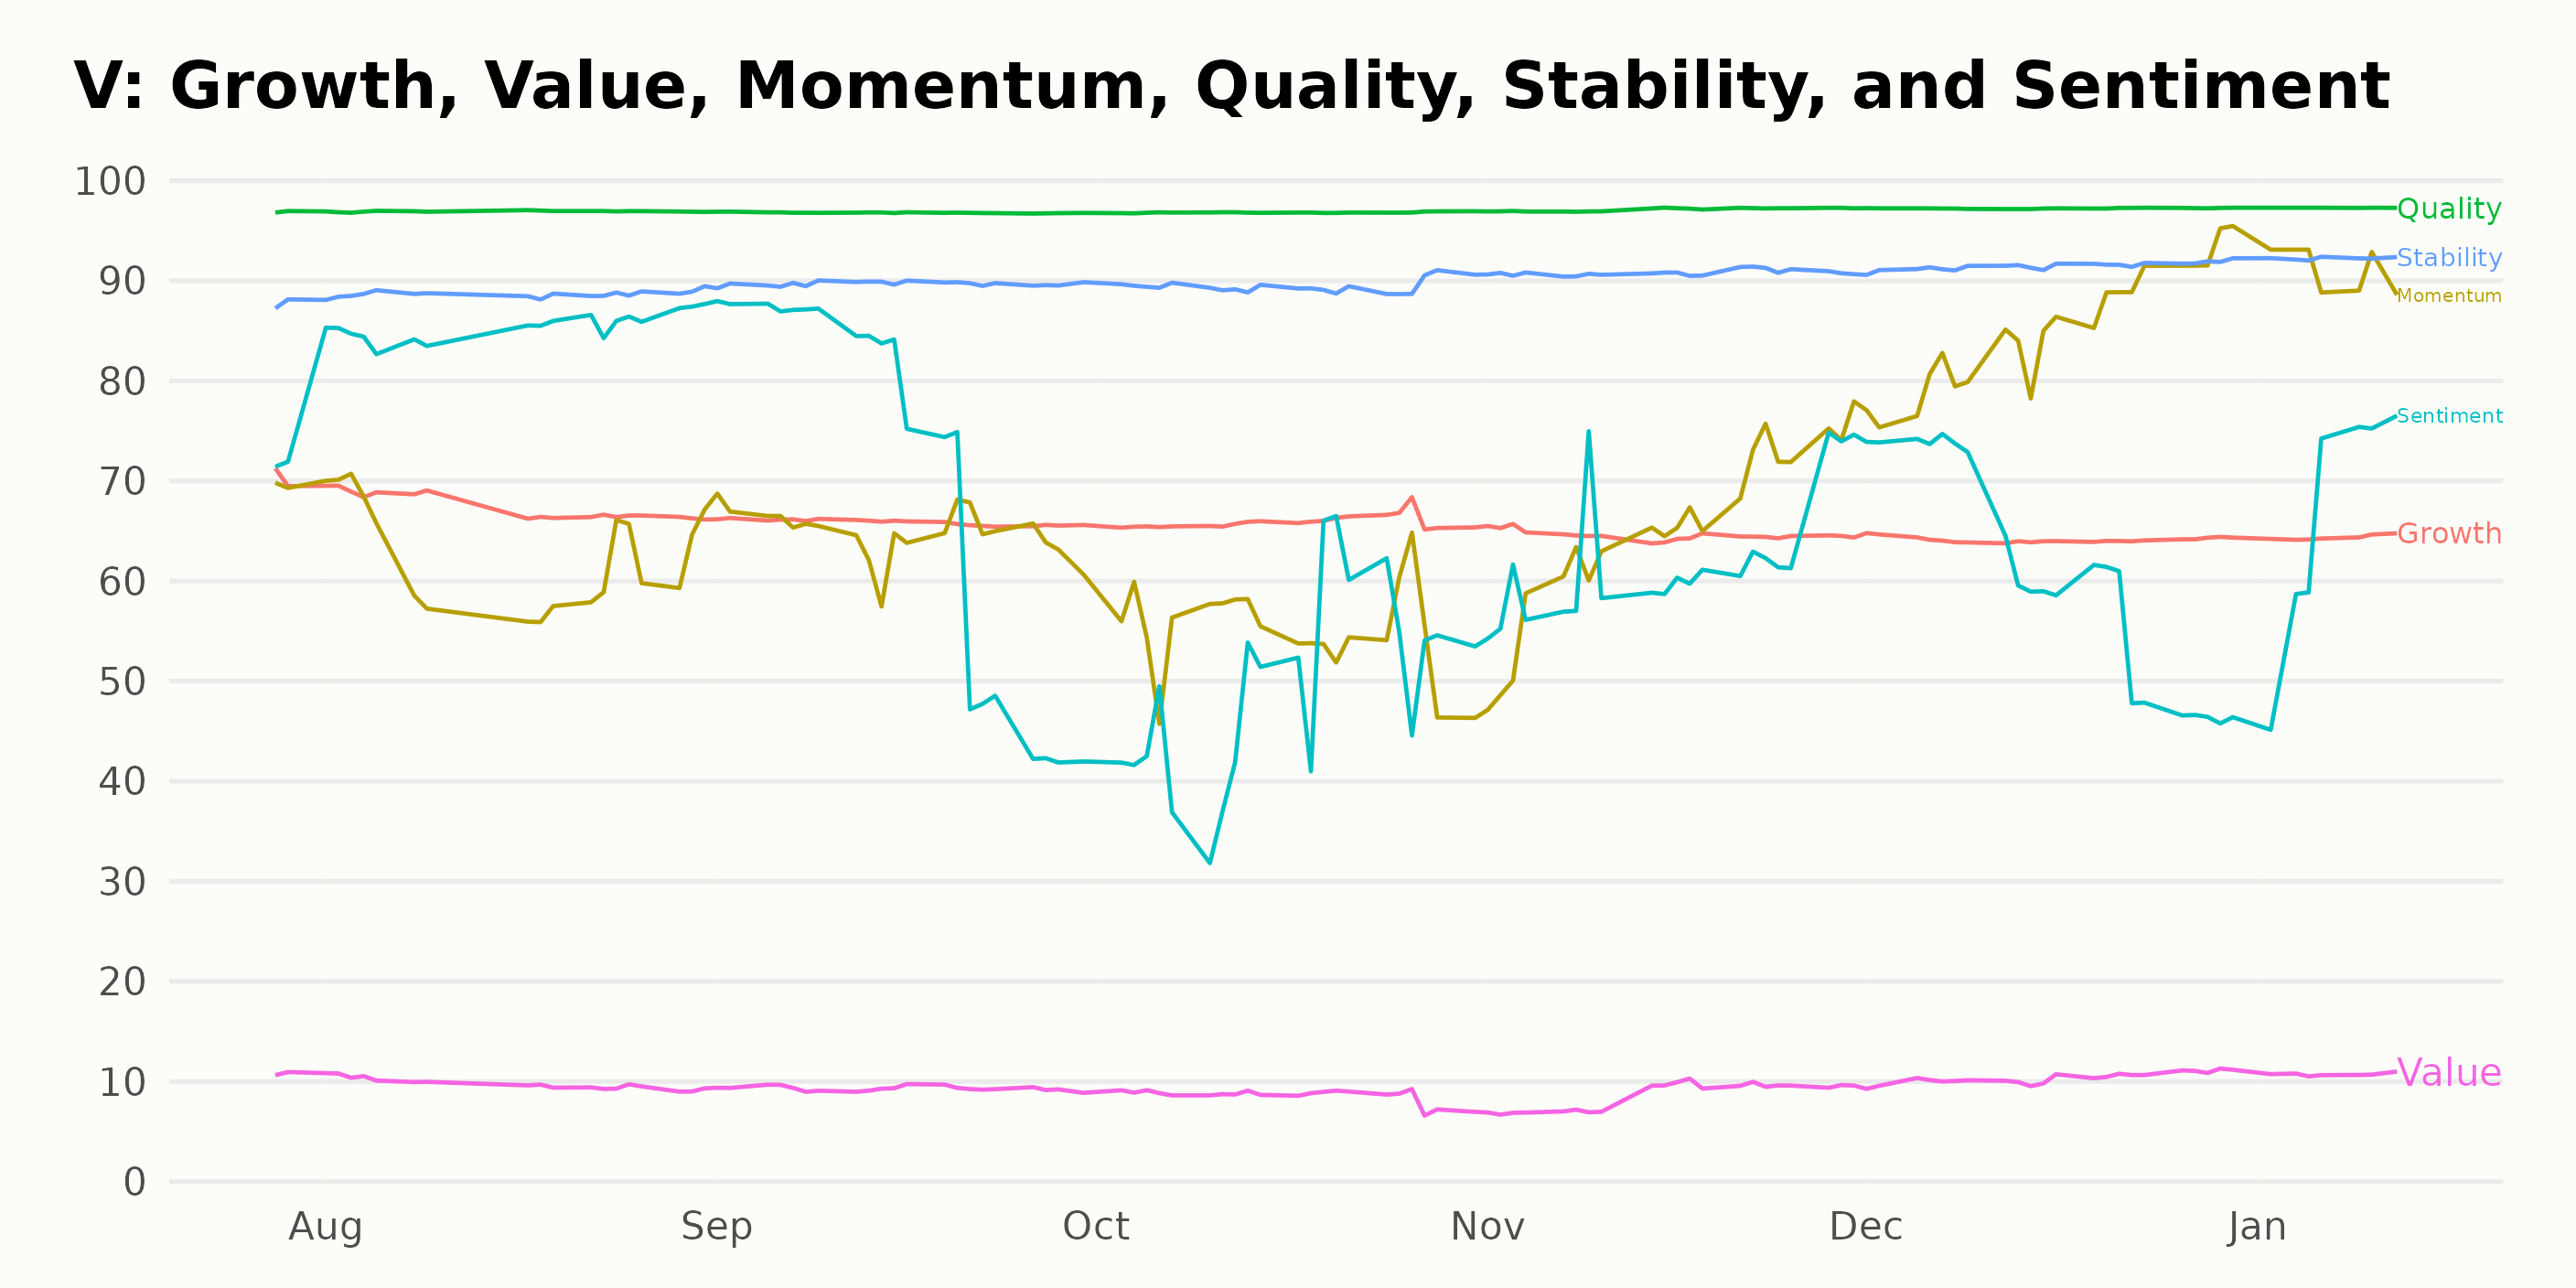
In analyzing the POWR Ratings for Visa Inc., the three most noteworthy dimensions are Quality, Stability, and Momentum. Here's how these dimensions perform:
Quality: Throughout the entire period from July 2023 to January 2024, Quality has consistently maintained the highest rating of 97.
Stability: The Stability of Visa Inc.'s ratings shows an incremental trend. In July 2023, it stood at 88, increased steadily to reach 89 in October 2023, moved up to 91 in November 2023, and finally reached 92 by January 2024.
Momentum: Momentum saw fluctuations during this period. It started with a rating of 70 in July 2023, decreased to 55 in October 2023, and marked a high at 91 in January 2024. This suggests a strong upward trend in the closing months of 2023 and the start of 2024.
It's clear that Visa Inc. has maintained extreme Quality performance across the specified timeframe while simultaneously showing an increment in Stability. Momentum, too, witnessed a notable rise towards the end of the period.
How does Visa Inc. (V) Stack Up Against its Peers?
While V has an overall B (Buy) rating, other stocks in the Consumer Financial Services sector that may be worth considering are Regional Management Corp. (RM), Qifu Technology, Inc. (QFIN), and EZCORP, Inc. (EZPW) - they have an overall rating of A (Strong Buy) or B (Buy). Click here to explore more Consumer Financial Services stocks.
What To Do Next?
43 year investment veteran, Steve Reitmeister, has just released his 2024 market outlook along with trading plan and top 11 picks for the year ahead.
V shares were trading at $272.02 per share on Wednesday morning, up $0.76 (+0.28%). Year-to-date, V has gained 4.48%, versus a 2.64% rise in the benchmark S&P 500 index during the same period.
About the Author: Anushka Dutta

Anushka is an analyst whose interest in understanding the impact of broader economic changes on financial markets motivated her to pursue a career in investment research.
The post Visa Inc. (V) Earnings Spotlight: What to Watch for in the Report appeared first on StockNews.com