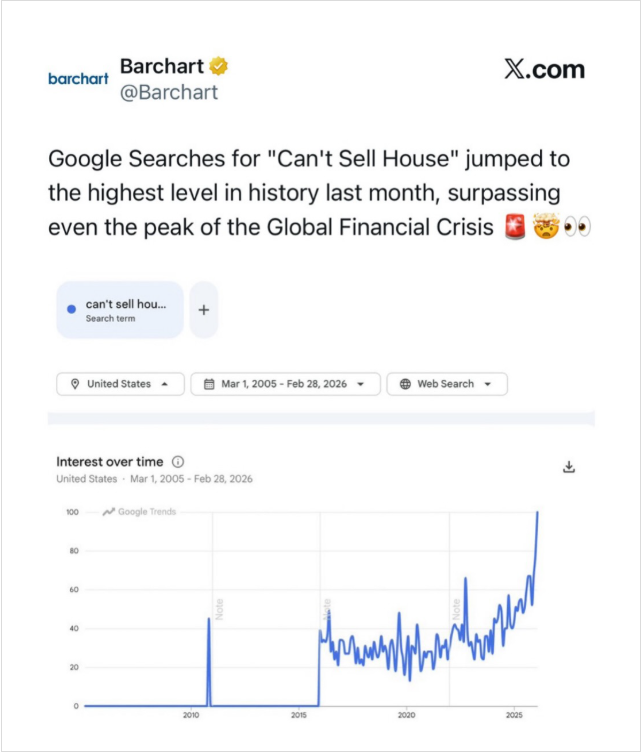
While the economic focus right now is on spiking oil prices, there's another major story taking shape in the background. New data shows that Google searches for “Can’t Sell My House” have surged to their highest level ever — surpassing even the peak of the 2008 Global Financial Crisis.
This isn’t just a slowdown. It’s something else entirely.
The housing market isn’t crashing. It’s stuck.
The “Housing Clog” No One Is Talking About
At first glance, the housing market doesn’t look broken. Prices haven’t collapsed, and foreclosures aren’t spiking like 2008.
But underneath the surface, something unusual is happening: transactions are freezing.
Search interest for “Can’t Sell My House” recently hit a perfect 100/100 on Google Trends, compared to just 45 at the peak of 2008.
That suggests something even more dangerous than a crash: a complete breakdown in liquidity. In other words, homes are sitting. Buyers aren’t buying. Sellers aren’t lowering prices.
The market hasn’t fallen apart. Instead, it’s locked in place.
The Rise of the “Accidental Landlord”
With homes failing to sell, many owners are making a last-minute pivot: They’re turning into landlords.
An estimated $700 billion worth of housing inventory is currently sitting without buyers, forcing more sellers to rent out properties instead of closing deals. In the last 30 days alone, roughly 2.3% of sellers have pulled listings and converted to rentals.
It’s a trend that hasn’t been seen at scale since the aftermath of the financial crisis. Back then, it was driven by foreclosures.
Today, it’s driven by a different catalyst. Nobody wants to sell at a loss — and nobody can afford to buy.
Why This Isn’t 2008 (It Might Be Worse)
The 2008 crash was triggered by bad loans. This time, the problem is structural.
Millions of homeowners are locked into ultra-low mortgage rates from previous years. Selling would mean giving up a 3% loan and replacing it with one closer to 6.5%.
So they don’t sell.
At the same time, new buyers are being priced out entirely.
The result is a market where:
- Sellers won’t lower prices
- Buyers can’t afford current prices
- Transactions collapse
Instead of forced selling, we get frozen supply. And instead of panic, we get gridlock.
The Market Is Starting to Price It In
That pressure is beginning to show up in housing-related stocks.
Lennar (LEN), one of the largest U.S. homebuilders, recently reported revenue down 13.3% year-over-year, missing expectations.
Barchart Technical Opinion on LEN is currently a 100% Strong Sell. The stock has entered a bearish trend, trading below key moving averages as high mortgage rates and "constrained affordability" continue to sap consumer sentiment.
More broadly, the homebuilder sector — tracked by ETFs like the SPDR S&P Homebuilders ETF (XHB) — is starting to reflect a market that may be collapsing.
The Bigger Risk
Housing doesn’t just impact homeowners.
It drives:
- Consumer spending
- Construction jobs
- Bank lending
- Local economies
When housing activity slows, everything else tends to follow. And right now, the issue isn’t just declining demand. It’s no movement at all.
The Bottom Line
The 2008 housing crisis was driven by forced selling and collapsing prices. What we’re seeing now is different.
Sellers are locked into low rates and refuse to cut prices, while buyers are priced out by higher borrowing costs. The result isn’t a crash; it’s a market that has stopped moving.
And when liquidity finally disappears, price stability rarely holds for long.
On the date of publication, Barchart Insights did not have (either directly or indirectly) positions in any of the securities mentioned in this article. All information and data in this article is solely for informational purposes. For more information please view the Barchart Disclosure Policy here.
More news from Barchart