
Life sciences company Thermo Fisher (NYSE: TMO) reported Q4 CY2025 results beating Wall Street’s revenue expectations, with sales up 7.2% year on year to $12.22 billion. Its non-GAAP profit of $6.57 per share was 1.9% above analysts’ consensus estimates.
Is now the time to buy Thermo Fisher? Find out by accessing our full research report, it’s free.
Thermo Fisher (TMO) Q4 CY2025 Highlights:
- Revenue: $12.22 billion vs analyst estimates of $11.96 billion (7.2% year-on-year growth, 2.1% beat)
- Adjusted EPS: $6.57 vs analyst estimates of $6.45 (1.9% beat)
- Adjusted EBITDA: $2.55 billion vs analyst estimates of $3.13 billion (20.8% margin, 18.5% miss)
- Operating Margin: 18.5%, in line with the same quarter last year
- Organic Revenue rose 3% year on year (beat)
- Market Capitalization: $228.4 billion
“Thanks to our exceptional team, we delivered a strong finish to 2025, reflecting outstanding execution and the continued strength of our proven growth strategy,” said Marc N. Casper, chairman, president and chief executive officer of Thermo Fisher Scientific.
Company Overview
With over 14,000 sales personnel and a portfolio spanning more than 2,500 technology manufacturers, Thermo Fisher Scientific (NYSE: TMO) provides scientific equipment, reagents, consumables, software, and laboratory services to pharmaceutical, biotech, academic, and healthcare customers worldwide.
Revenue Growth
A company’s long-term sales performance can indicate its overall quality. Any business can experience short-term success, but top-performing ones enjoy sustained growth for years. Regrettably, Thermo Fisher’s sales grew at a mediocre 6.7% compounded annual growth rate over the last five years. This was below our standard for the healthcare sector and is a poor baseline for our analysis.
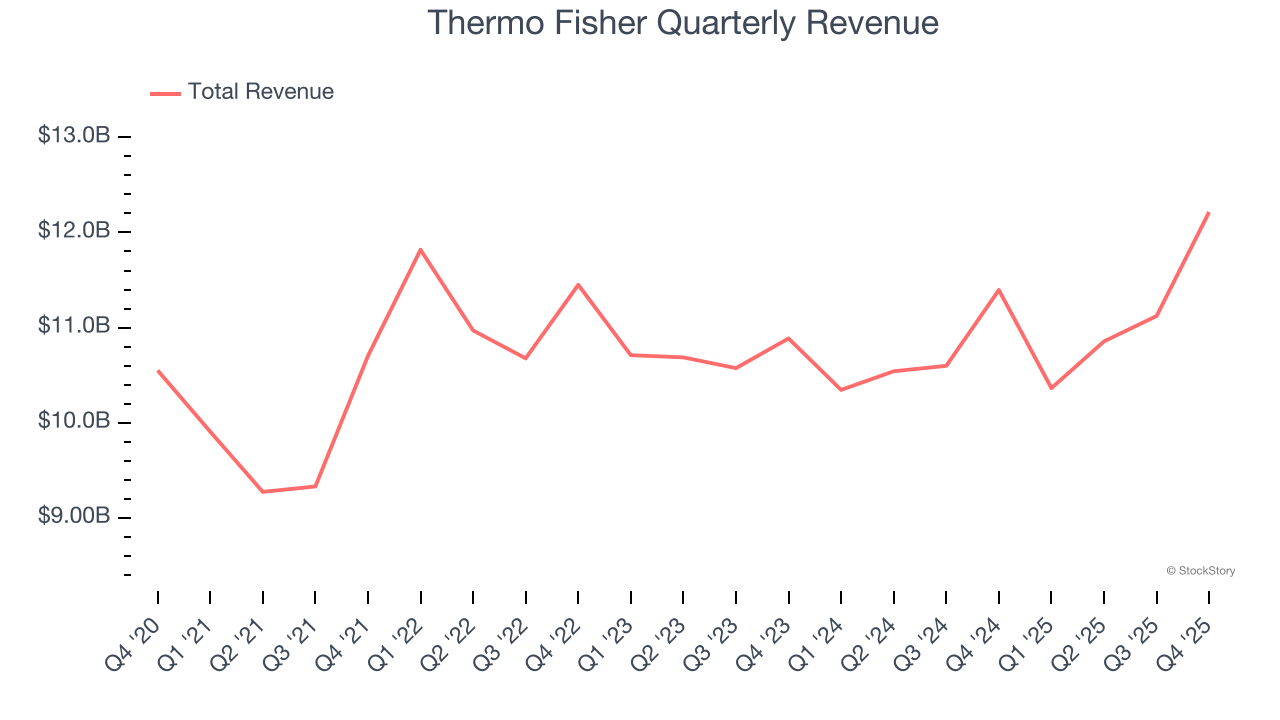
We at StockStory place the most emphasis on long-term growth, but within healthcare, a half-decade historical view may miss recent innovations or disruptive industry trends. Thermo Fisher’s recent performance shows its demand has slowed as its annualized revenue growth of 2% over the last two years was below its five-year trend. 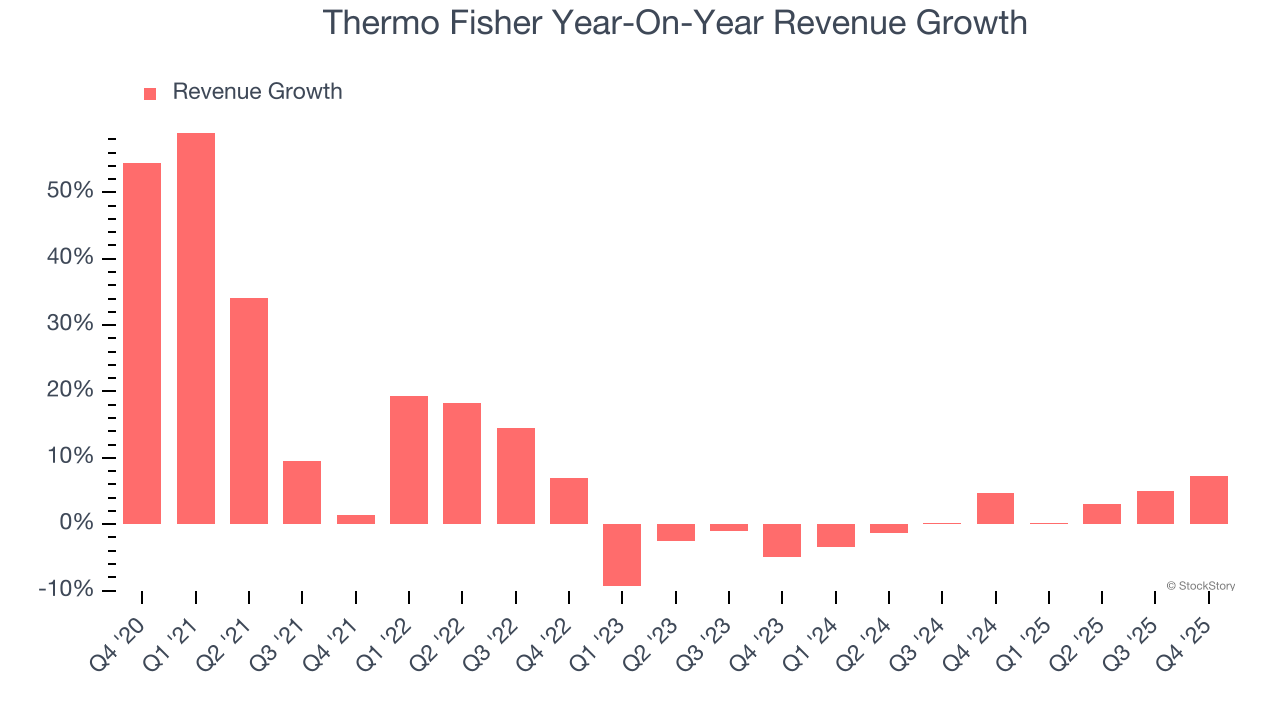
Thermo Fisher also reports organic revenue, which strips out one-time events like acquisitions and currency fluctuations that don’t accurately reflect its fundamentals. Over the last two years, Thermo Fisher’s organic revenue was flat. Because this number aligns with its two-year revenue growth, we can see the company’s core operations (not acquisitions and divestitures) drove most of its results. 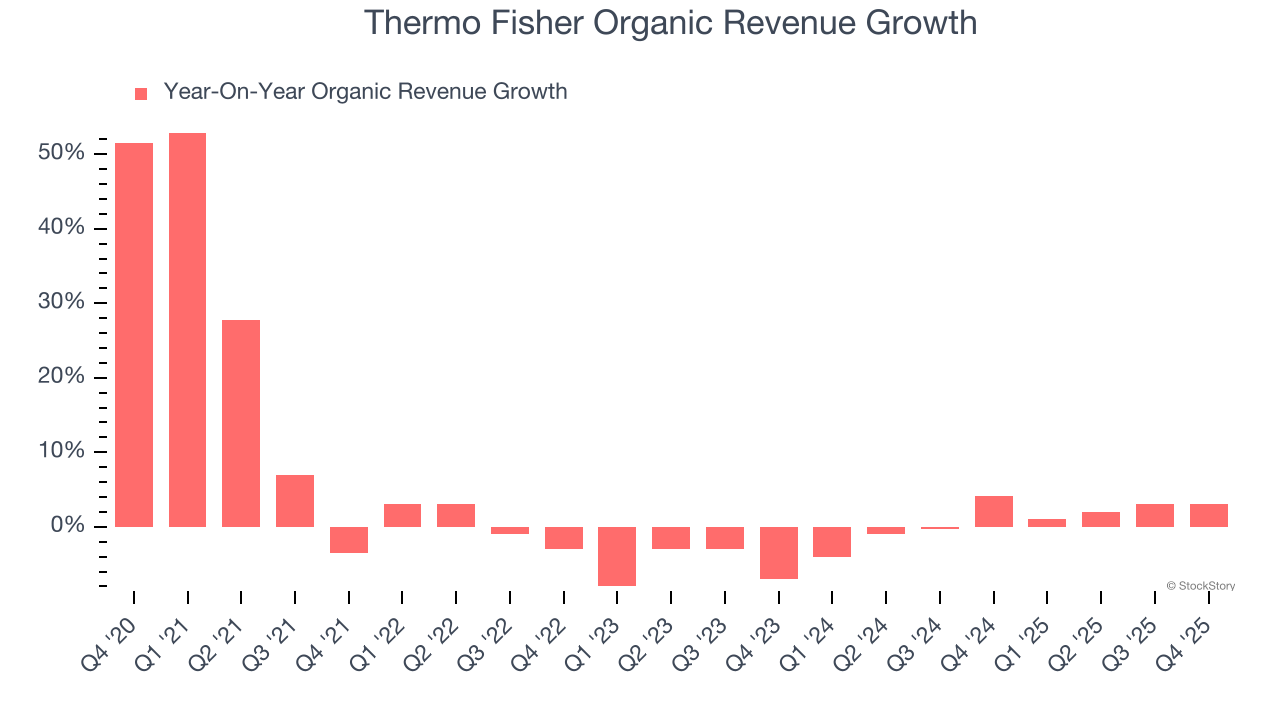
This quarter, Thermo Fisher reported year-on-year revenue growth of 7.2%, and its $12.22 billion of revenue exceeded Wall Street’s estimates by 2.1%.
Looking ahead, sell-side analysts expect revenue to grow 4.5% over the next 12 months. While this projection implies its newer products and services will fuel better top-line performance, it is still below average for the sector.
The 1999 book Gorilla Game predicted Microsoft and Apple would dominate tech before it happened. Its thesis? Identify the platform winners early. Today, enterprise software companies embedding generative AI are becoming the new gorillas. a profitable, fast-growing enterprise software stock that is already riding the automation wave and looking to catch the generative AI next.
Operating Margin
Thermo Fisher has managed its cost base well over the last five years. It demonstrated solid profitability for a healthcare business, producing an average operating margin of 18.8%.
Looking at the trend in its profitability, Thermo Fisher’s operating margin decreased by 8.2 percentage points over the last five years, but it rose by 1.4 percentage points on a two-year basis. Still, shareholders will want to see Thermo Fisher become more profitable in the future.
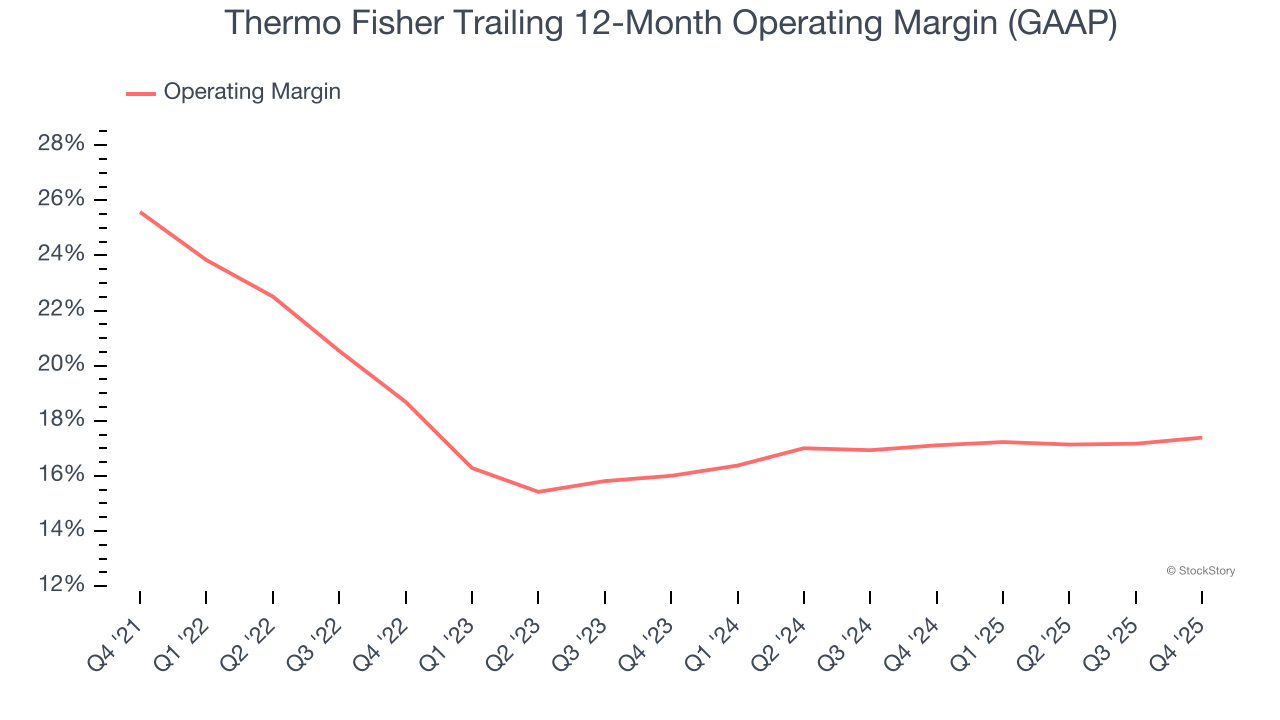
In Q4, Thermo Fisher generated an operating margin profit margin of 18.5%, in line with the same quarter last year. This indicates the company’s overall cost structure has been relatively stable.
Earnings Per Share
Revenue trends explain a company’s historical growth, but the long-term change in earnings per share (EPS) points to the profitability of that growth – for example, a company could inflate its sales through excessive spending on advertising and promotions.
Thermo Fisher’s EPS grew at an unimpressive 3.2% compounded annual growth rate over the last five years, lower than its 6.7% annualized revenue growth. This tells us the company became less profitable on a per-share basis as it expanded due to non-fundamental factors such as interest expenses and taxes.
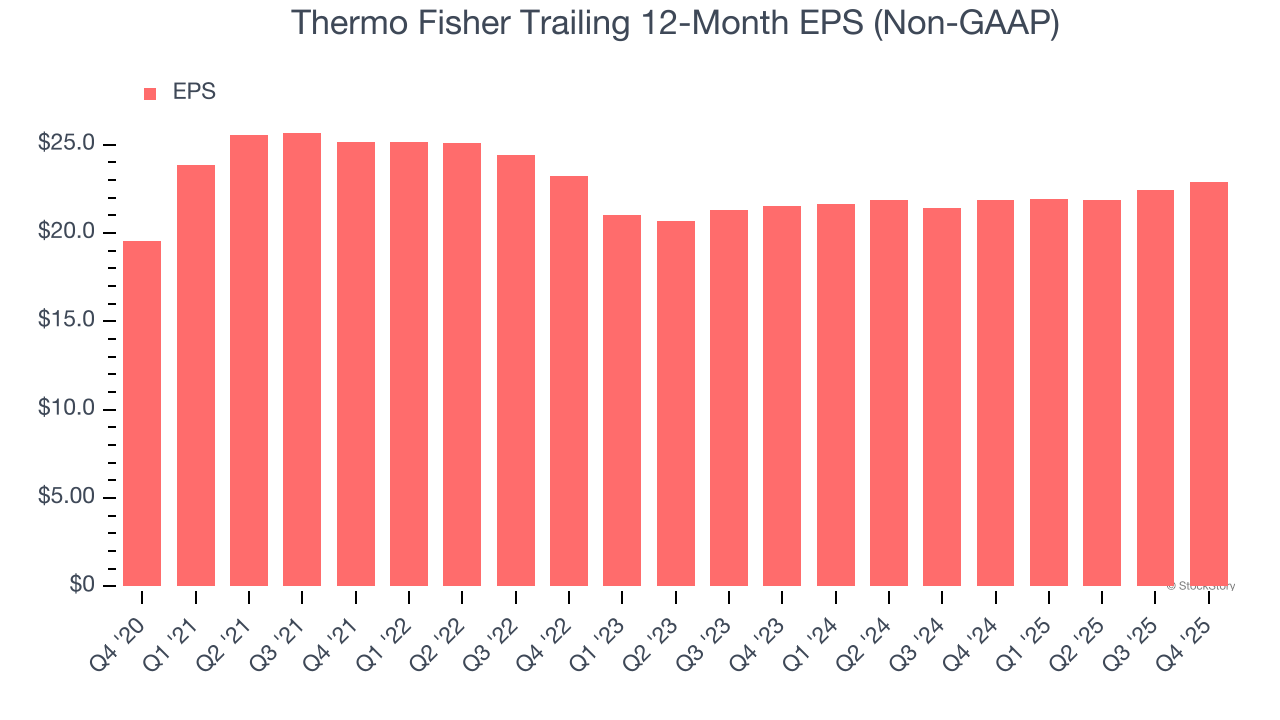
We can take a deeper look into Thermo Fisher’s earnings to better understand the drivers of its performance. As we mentioned earlier, Thermo Fisher’s operating margin was flat this quarter but declined by 8.2 percentage points over the last five years. This was the most relevant factor (aside from the revenue impact) behind its lower earnings; interest expenses and taxes can also affect EPS but don’t tell us as much about a company’s fundamentals.
In Q4, Thermo Fisher reported adjusted EPS of $6.57, up from $6.10 in the same quarter last year. This print beat analysts’ estimates by 1.9%. Over the next 12 months, Wall Street expects Thermo Fisher’s full-year EPS of $22.87 to grow 7.6%.
Key Takeaways from Thermo Fisher’s Q4 Results
It was encouraging to see Thermo Fisher beat analysts’ revenue expectations this quarter. We were also happy its organic revenue narrowly outperformed Wall Street’s estimates. On the other hand, its operating income slightly missed. Overall, this print had some key positives. The stock traded up 1.3% to $615.74 immediately following the results.
Is Thermo Fisher an attractive investment opportunity right now? What happened in the latest quarter matters, but not as much as longer-term business quality and valuation, when deciding whether to invest in this stock. We cover that in our actionable full research report which you can read here (it’s free).


