
Industrial fluid and energy systems manufacturer Graham Corporation (NYSE: GHM) reported Q4 CY2025 results exceeding the market’s revenue expectations, with sales up 20.5% year on year to $56.7 million. The company expects the full year’s revenue to be around $236 million, close to analysts’ estimates. Its non-GAAP profit of $0.31 per share was 69.1% above analysts’ consensus estimates.
Is now the time to buy Graham Corporation? Find out by accessing our full research report, it’s free.
Graham Corporation (GHM) Q4 CY2025 Highlights:
- Revenue: $56.7 million vs analyst estimates of $52.35 million (20.5% year-on-year growth, 8.3% beat)
- Adjusted EPS: $0.31 vs analyst estimates of $0.18 (69.1% beat)
- Adjusted EBITDA: $6.04 million vs analyst estimates of $4.81 million (10.7% margin, 25.7% beat)
- The company lifted its revenue guidance for the full year to $236 million at the midpoint from $230 million, a 2.6% increase
- EBITDA guidance for the full year is $26 million at the midpoint, above analyst estimates of $25.38 million
- Operating Margin: 5.5%, down from 6.5% in the same quarter last year
- Free Cash Flow was $2.43 million, up from -$2.11 million in the same quarter last year
- Backlog: $515.6 million at quarter end, up 33.9% year on year
- Market Capitalization: $810.4 million
Graham’s President and Chief Executive Officer, Matthew J. Malone stated, “Our third quarter results reflect continued strong, disciplined execution across the organization as we progress through the back half of fiscal 2026. Revenue growth and profitability were driven by solid performance across our end markets and supported by a record backlog, which provides meaningful visibility into future demand. Activity in our Defense market remains robust, while the Energy & Process and Space markets continue to perform in line with our expectations.”
Company Overview
Founded when its founder patented a unique design for a vacuum system used in the sugar refining process, Graham (NYSE: GHM) provides vacuum and heat transfer equipment for the energy, petrochemical, refining, and chemical sectors.
Revenue Growth
A company’s long-term performance is an indicator of its overall quality. Any business can put up a good quarter or two, but the best consistently grow over the long haul. Over the last five years, Graham Corporation grew its sales at an incredible 20.1% compounded annual growth rate. Its growth beat the average industrials company and shows its offerings resonate with customers.
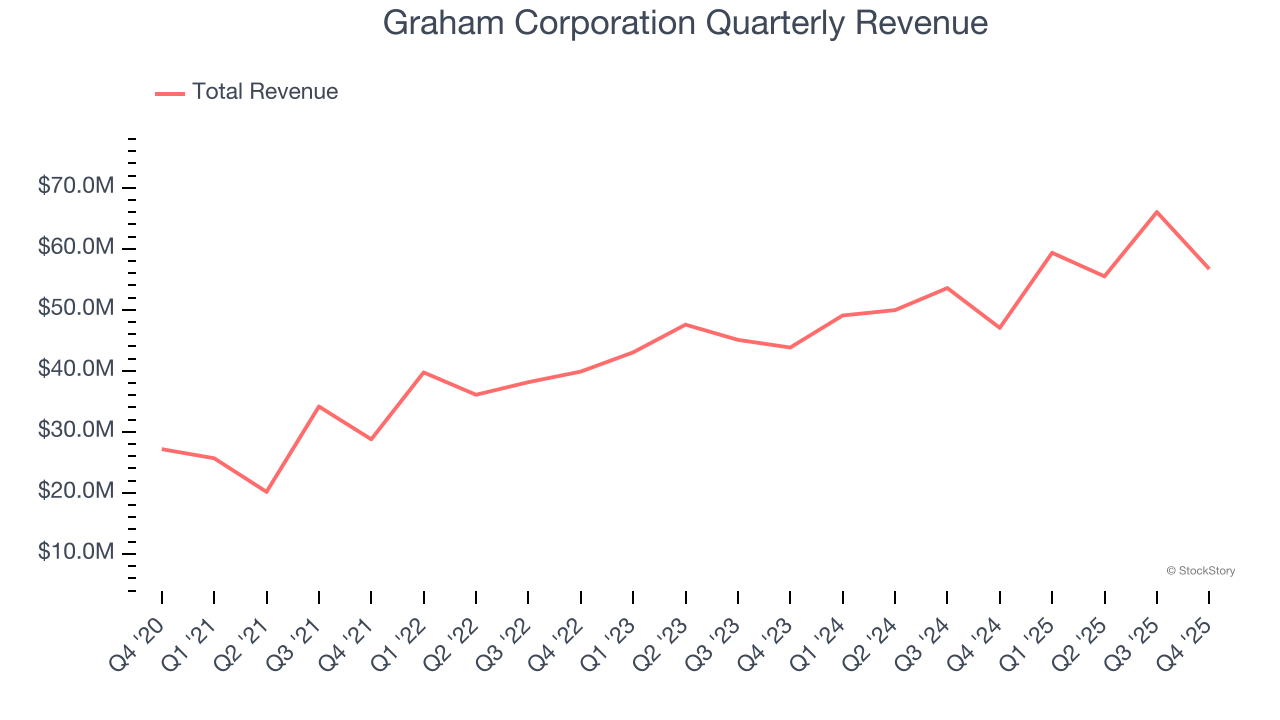
Long-term growth is the most important, but within industrials, a half-decade historical view may miss new industry trends or demand cycles. Graham Corporation’s annualized revenue growth of 15% over the last two years is below its five-year trend, but we still think the results suggest healthy demand. 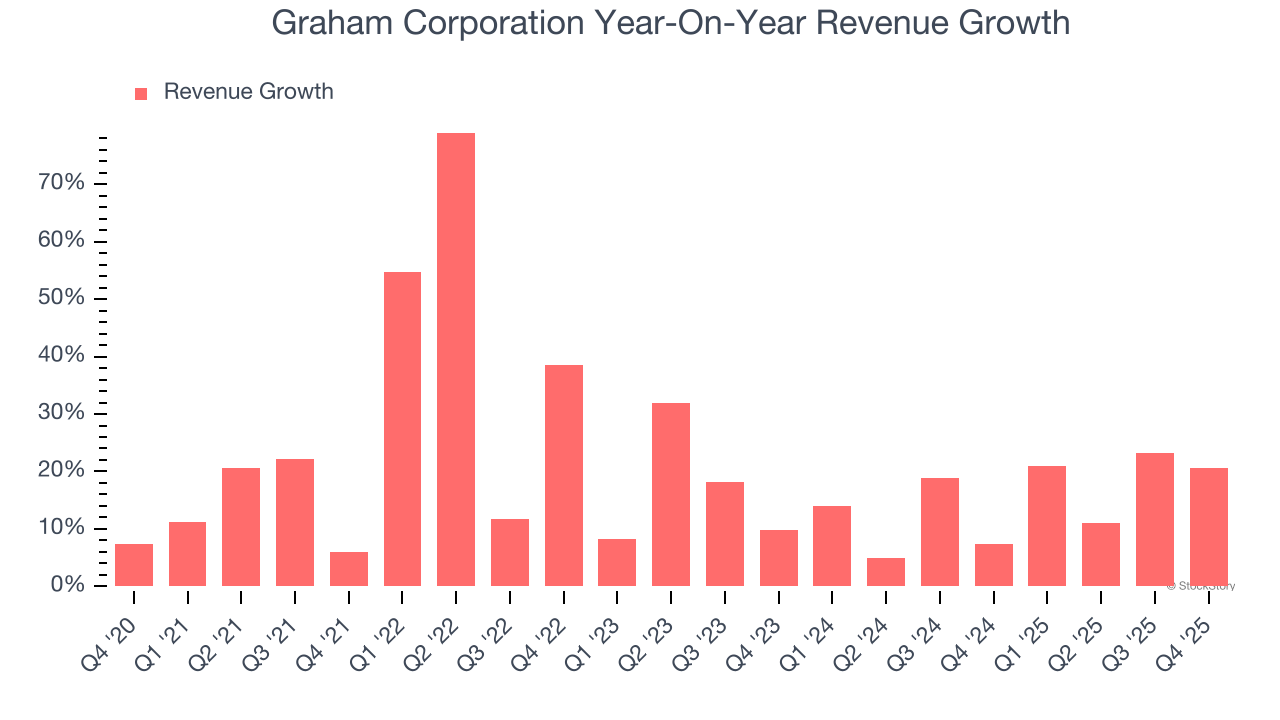
We can dig further into the company’s revenue dynamics by analyzing its backlog, or the value of its outstanding orders that have not yet been executed or delivered. Graham Corporation’s backlog reached $515.6 million in the latest quarter and averaged 27.8% year-on-year growth over the last two years. Because this number is better than its revenue growth, we can see the company accumulated more orders than it could fulfill and deferred revenue to the future. This could imply elevated demand for Graham Corporation’s products and services but raises concerns about capacity constraints. 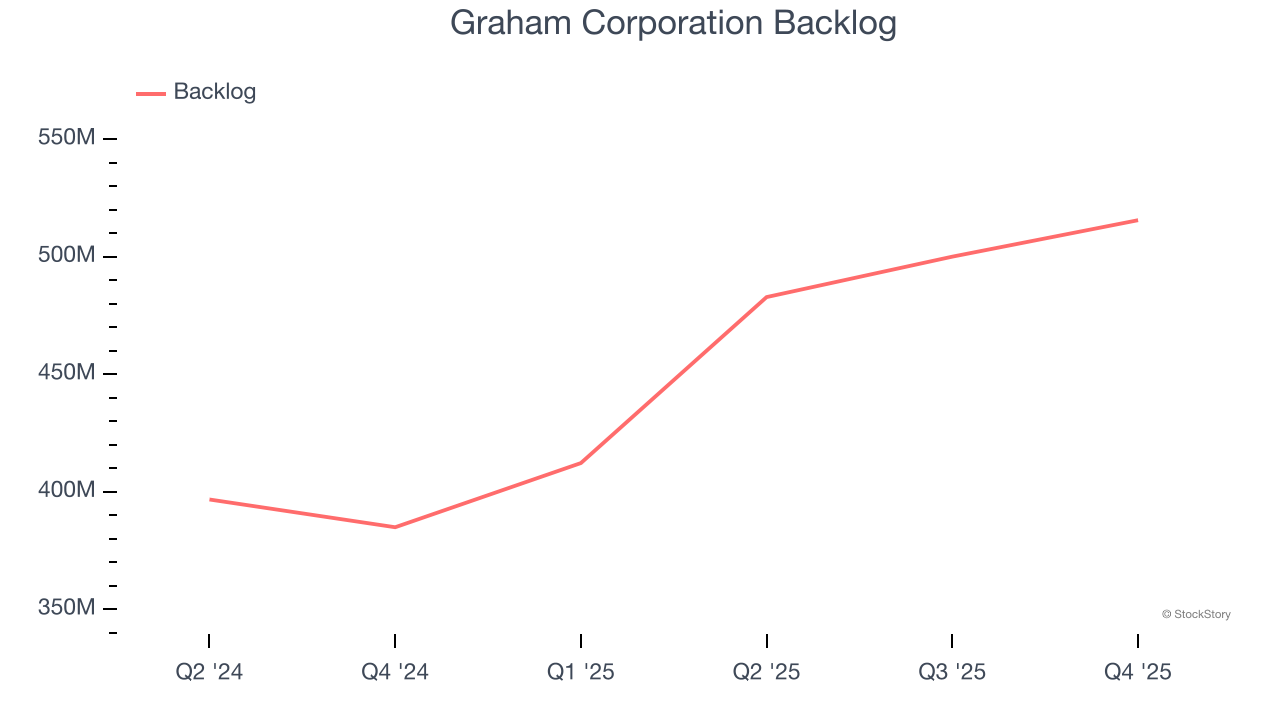
This quarter, Graham Corporation reported robust year-on-year revenue growth of 20.5%, and its $56.7 million of revenue topped Wall Street estimates by 8.3%.
Looking ahead, sell-side analysts expect revenue to grow 6.6% over the next 12 months, a deceleration versus the last two years. This projection is underwhelming and suggests its products and services will see some demand headwinds.
Microsoft, Alphabet, Coca-Cola, Monster Beverage—all began as under-the-radar growth stories riding a massive trend. We’ve identified the next one: a profitable AI semiconductor play Wall Street is still overlooking. Go here for access to our full report.
Operating Margin
Graham Corporation was profitable over the last five years but held back by its large cost base. Its average operating margin of 2.5% was weak for an industrials business. This result isn’t too surprising given its low gross margin as a starting point.
On the plus side, Graham Corporation’s operating margin rose by 14.2 percentage points over the last five years, as its sales growth gave it immense operating leverage.
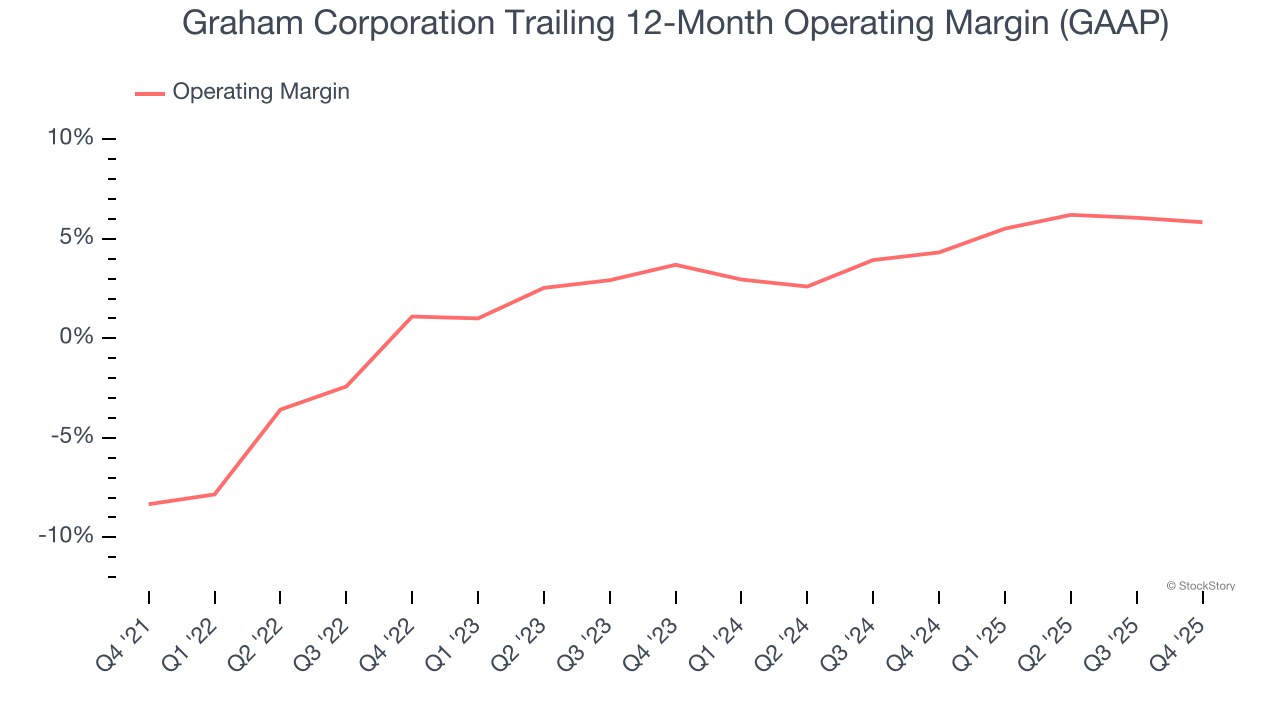
In Q4, Graham Corporation generated an operating margin profit margin of 5.5%, down 1 percentage points year on year. Since Graham Corporation’s gross margin decreased more than its operating margin, we can assume its recent inefficiencies were driven more by weaker leverage on its cost of sales rather than increased marketing, R&D, and administrative overhead expenses.
Earnings Per Share
Revenue trends explain a company’s historical growth, but the long-term change in earnings per share (EPS) points to the profitability of that growth – for example, a company could inflate its sales through excessive spending on advertising and promotions.
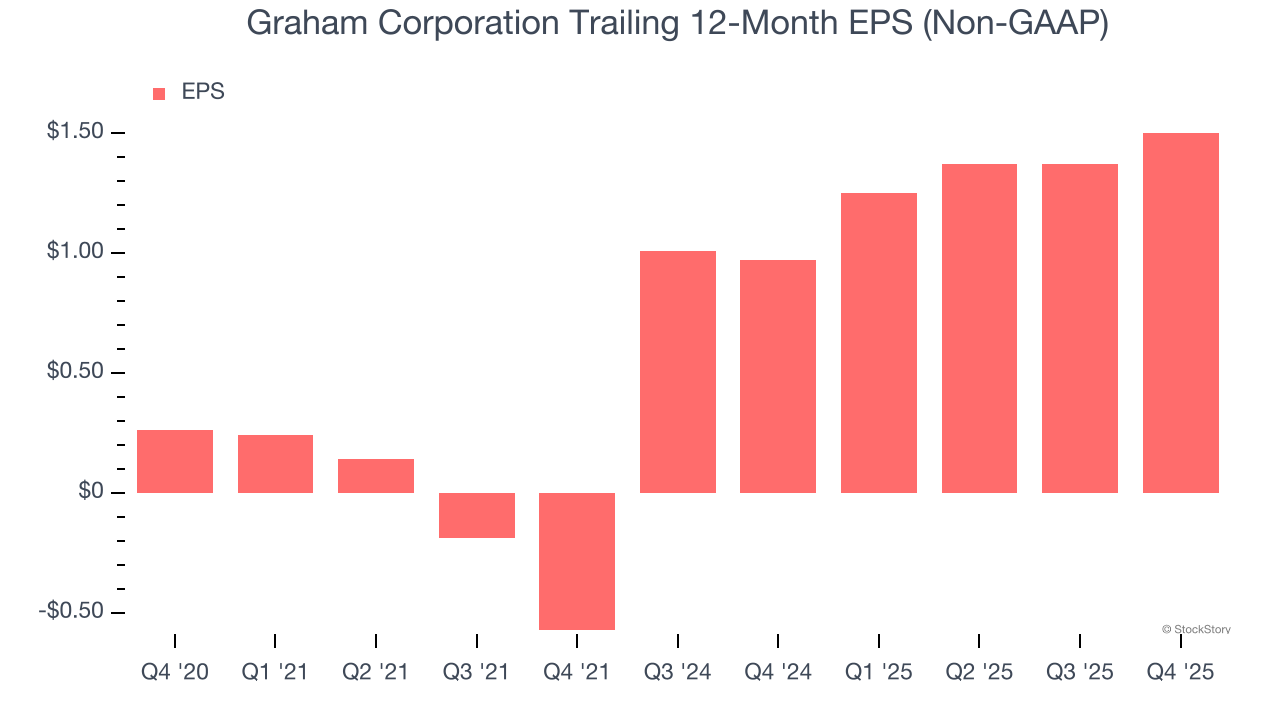
Graham Corporation’s EPS grew at an astounding 42% compounded annual growth rate over the last five years, higher than its 20.1% annualized revenue growth. This tells us the company became more profitable on a per-share basis as it expanded.
We can take a deeper look into Graham Corporation’s earnings to better understand the drivers of its performance. As we mentioned earlier, Graham Corporation’s operating margin declined this quarter but expanded by 14.2 percentage points over the last five years. This was the most relevant factor (aside from the revenue impact) behind its higher earnings; interest expenses and taxes can also affect EPS but don’t tell us as much about a company’s fundamentals.
Like with revenue, we analyze EPS over a shorter period to see if we are missing a change in the business.
For Graham Corporation, its one-year annual EPS growth of 83.3% was higher than its five-year trend. We love it when earnings growth accelerates, especially when it accelerates off an already high base.
In Q4, Graham Corporation reported adjusted EPS of $0.31, up from $0.18 in the same quarter last year. This print easily cleared analysts’ estimates, and shareholders should be content with the results. Over the next 12 months, Wall Street expects Graham Corporation’s full-year EPS of $1.50 to grow 17%.
Key Takeaways from Graham Corporation’s Q4 Results
It was good to see Graham Corporation beat analysts’ EPS expectations this quarter. We were also excited its EBITDA outperformed Wall Street’s estimates by a wide margin. Zooming out, we think this was a good print with some key areas of upside. The stock remained flat at $73.75 immediately following the results.
Indeed, Graham Corporation had a rock-solid quarterly earnings result, but is this stock a good investment here? When making that decision, it’s important to consider its valuation, business qualities, as well as what has happened in the latest quarter. We cover that in our actionable full research report which you can read here (it’s free).


